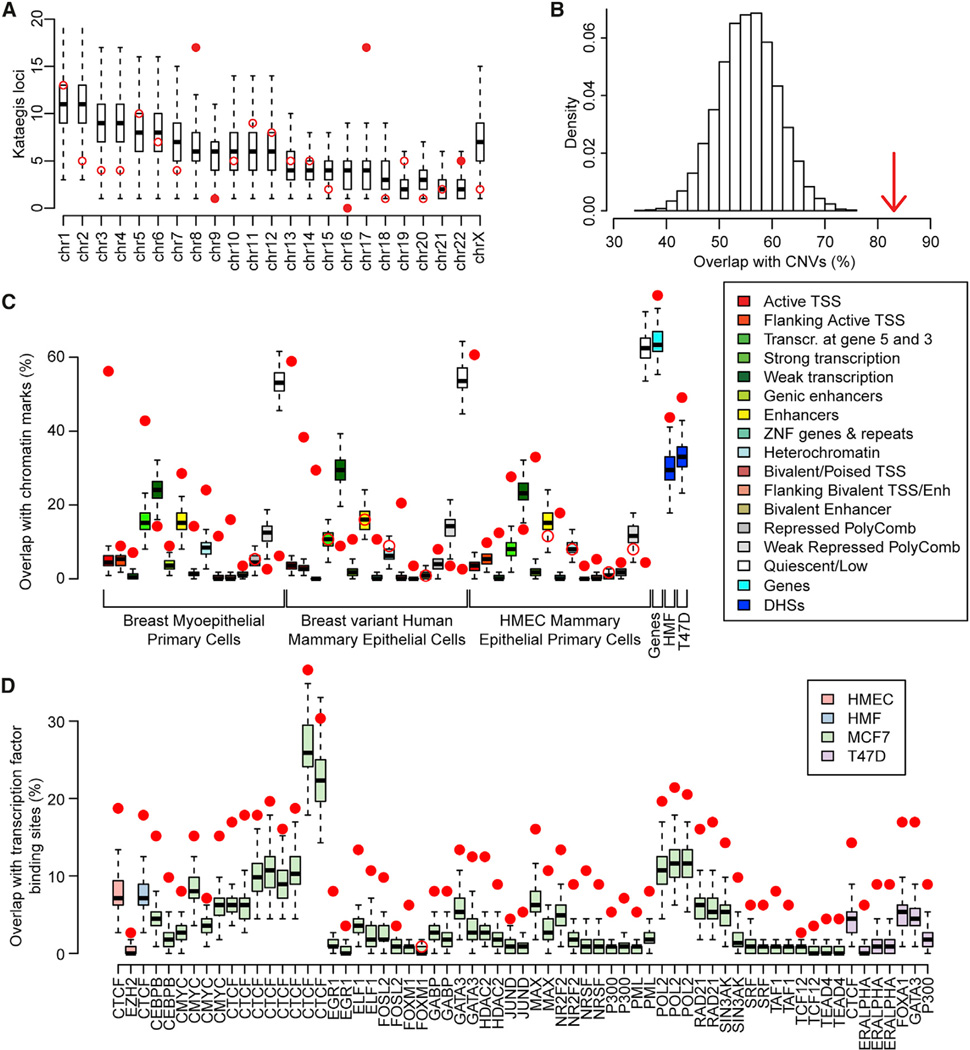
Figure 2. Associations between Kataegis Loci and Chromatin Features.
(A and B) Distributions of kataegis loci (A) in each chromosome and (B) overlapping CNVs. Red circles represent the observed number of kataegis loci, while the distributions of kataegis loci based on 10,000 permutations are represented by boxplots in (A) and as a histogram in (B). Filled circles in (A) show the chromosomes with a Z score >2. The arrow in (B) shows the observed percentage of kataegis loci that overlap CNVs (Z score = 5.28).
(C and D) Boxplots showing the expected overlap between kataegis loci and (C) chromatin states from three Roadmap breast cell lines, Gencode genes, and DHSs in two ENCODE breast cell lines and (D) transcription factor binding sites derived from 66 ChIP-seq experiments in four ENCODE breast cell lines. Filled circles show a Z score >2 or a Z score <-2.
See also Table S2.

