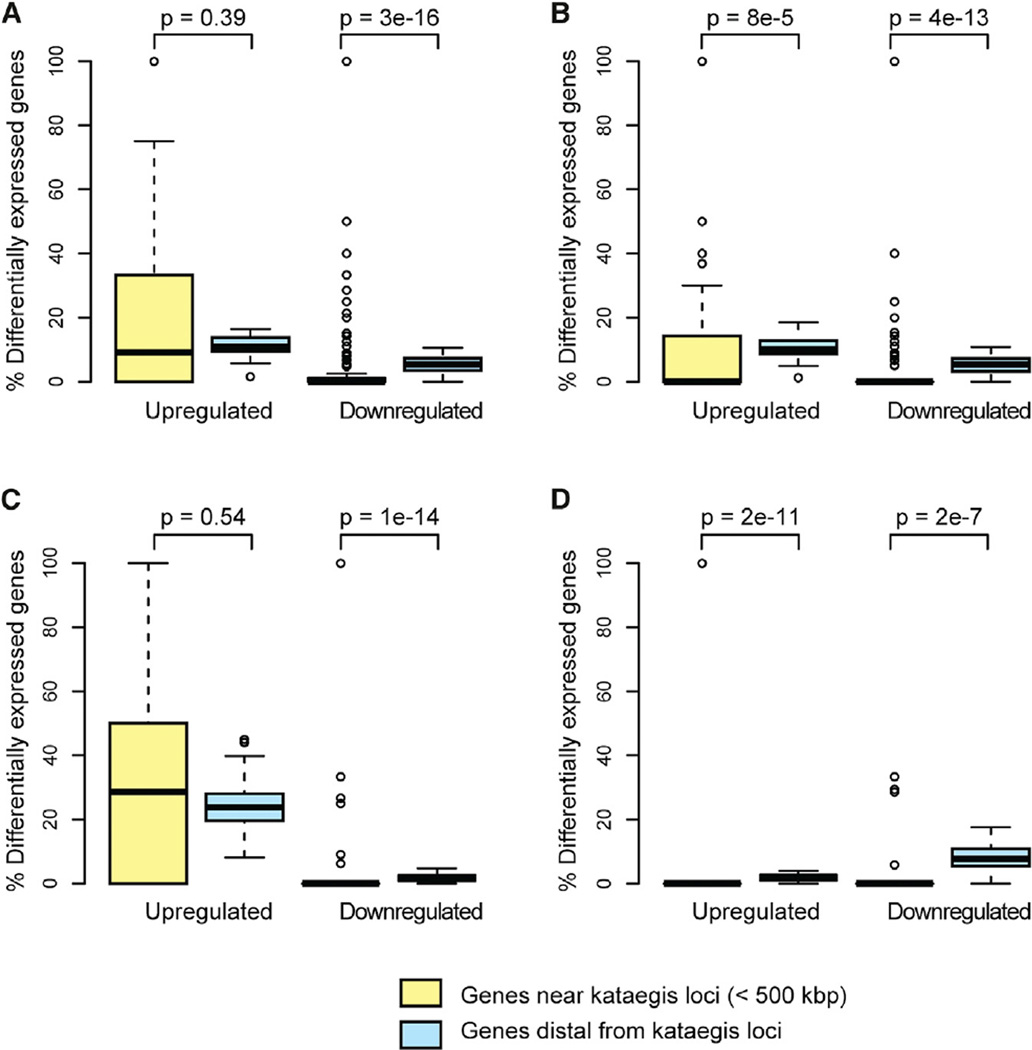
Figure 3. Influence of Kataegis Loci on Local Gene Expression.
Boxplots showing the percentage of upregulated and downregulated genes near to (<500 kbp) and distal from kataegis loci for (A) all kataegis loci (n = 132), (B) kataegis loci that do not overlap CNVs (n = 49), (C) kataegis loci that overlap CNV amplifications (n = 39), and (D) kataegis loci that overlap CNV deletions (n = 44). The p values were calculated with a Wilcoxon test.

