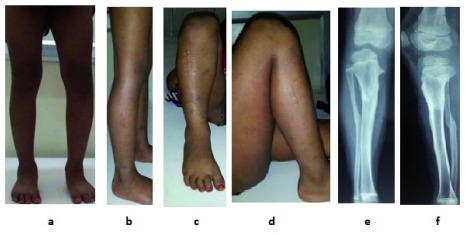
Figure 6. Clinical picture of correction at 2 years follow-up.
a. Standing front view shows deformity is corrected to normal and comparable to the opposite side, b. Standing side view shows deformity is corrected, c. Front view of leg in knee flexed position, d. Side view of leg in knee flexed position, e & f. X-ray AP and lateral view shows consolidation of osteotomy site with normal tibial mechanical axis.

