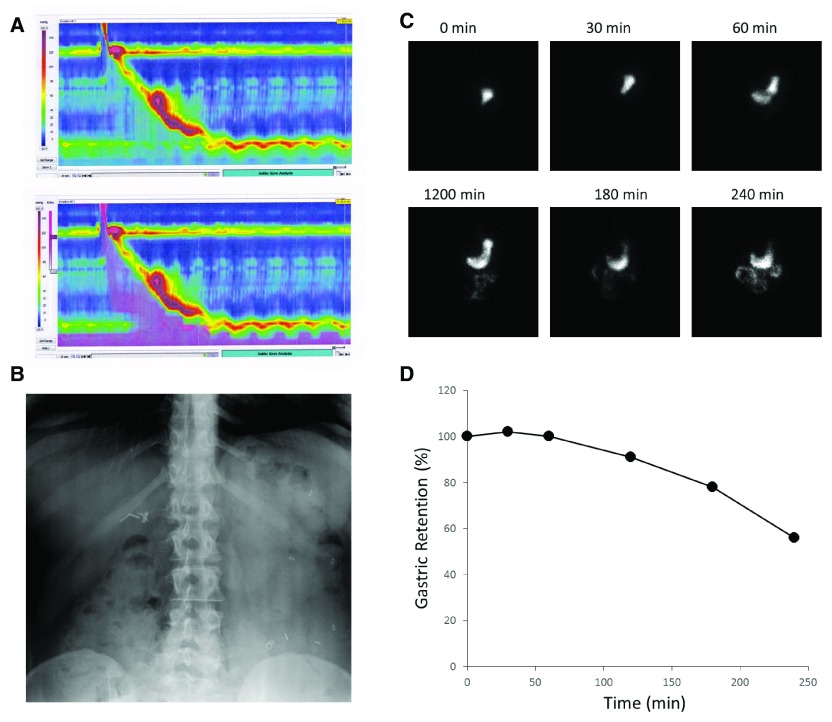
Figure 1. Examples of clinically used assessments of gastrointestinal (GI) motility.
Panel A demonstrates a pseudocolor display of esophageal pressure changes in response to a swallow (upper panel). The associated changes in impedance, caused by the traversing fluid bolus, are superimposed in purple in the lower panel. In Panel B, radio-opaque markers can be seen in the stool-filled colon (mostly accumulated on the left side) and allow an estimate of whole gut transit time. Gastric emptying of a radioactively labeled meal is documented with intermittent scintigraphic imaging (Panel C) and plotted as a function of time (Panel D).

