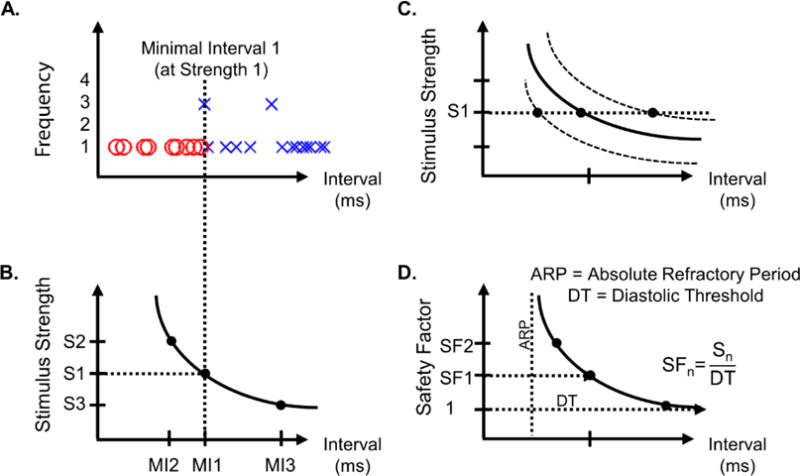
Figure 2.

The boundary observed in (A) and its associated interval and strength make up a point on the strength- interval curve (B). Changes in the ability to elicit a contraction of the myocardial tissue would become evident in the strength-interval curve as an upwards or downwards shift (C) and would appear as a longer or shorter minimal interval (MI), respectively. If diastolic threshold is estimated, the safety factor of a given stimulus strength could be determined (D).
