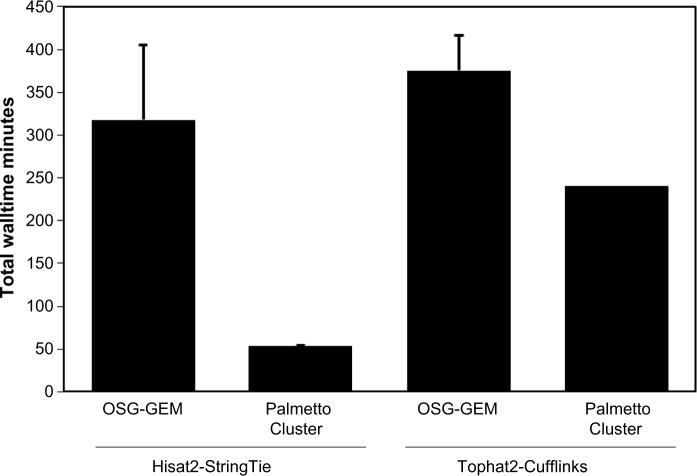
Figure 4.
Walltime comparison between the OSG and Palmetto Cluster. Total workflow walltime of OSG-GEM workflows was compared with the total walltime of equivalent workflows processed as single jobs on Clemson University’s Palmetto Cluster. A representative dataset containing 5,000,000 paired-end sequencing reads was mapped to the human-reference genome followed by RNA molecule quantification using a combination of Hisat2-StringTie or Tophat2-Cufflinks. Error bars represent the standard error of the mean (n = 3).

