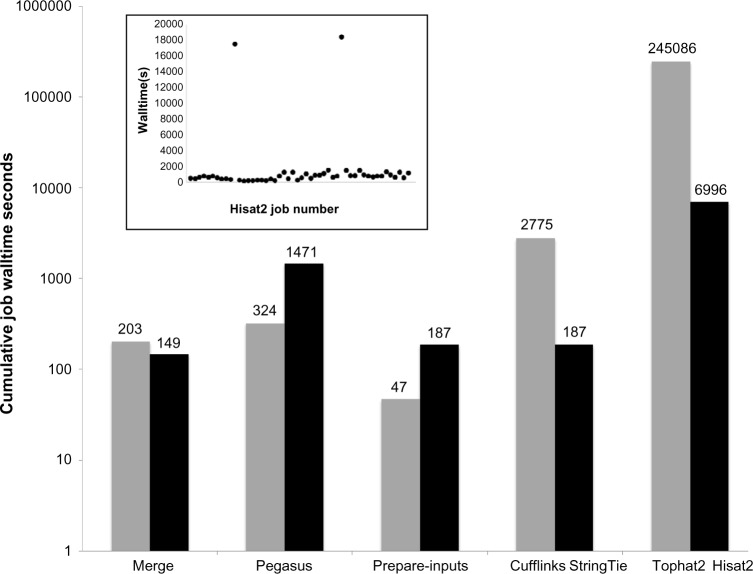
Figure 5.
OSG-GEM component performance. A 5,000,000 sequence dataset was processed using the Hisat2-StringTie and Tophat2-Cufflinks methods of OSG-GEM. The cumulative walltime for each step of the workflow is shown for TopHat2-Cufflinks (gray bars) and Hisat2-StringTie (black bars). The inset scatterplot presents the walltime of each Hisat2 job in the Hisat2-StringTie workflow.

