
Figure 3. The structure of the E178D selectivity filter mutant.
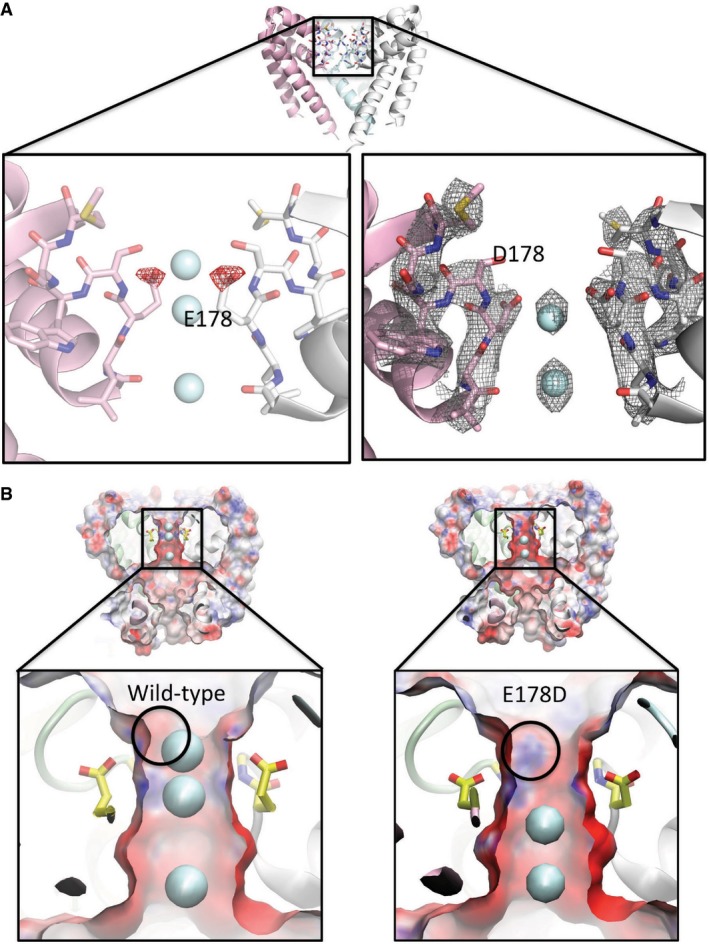
- Top: Crystal structure overview of the wild‐type AB tetramer (PDBID 5BZB), view as in Fig 2A. Left: Difference (Fo–Fc) electron density map (mutant minus wild‐type) contoured at −2.5 σ and drawn as red mesh, plotted on the structure of the wild‐type (E178) protein, highlighting the consequences of the loss of the δ‐carbon atom from residue 178 in the E178D mutant. For reference, the locations of the sodium ion sites present in the wild‐type (E178) structure are depicted as cyan spheres. Both the structure and the ions are displayed as faded backgrounds so that the difference map can be seen more clearly. Right: Final refined 2Fo–Fc electron density map for the E178D mutant (PDBID 4X88), contoured at 1.5 σ and shown as grey mesh, with the sodium ions depicted as cyan spheres.
- Surface representations of (left) wild‐type NavMs pore and (right) the E178D mutant coloured by electrostatic charge calculated by APBSmem (Callenberg et al, 2010) and drawn with VMD (Humphrey et al, 1996), showing a slice through the middle of the tetramer. Sodium ions are shown as cyan spheres; only 2 are present in the mutant, instead of the 3 seen in the wild‐type, with the top sodium missing in the mutant. The lower panels are expanded views of the selectivity filter regions, with the E178 side chains depicted in yellow sticks and the location of the main chain nitrogen of residue 179 indicated by the black circle. The alteration in the protein structure caused by removal of the methylene group of E178 exposes a positive region of the polypeptide backbone adjacent to the site where the top sodium ion is located in the wild‐type protein; this likely contributes to why an equivalent sodium ion is not seen adjacent to this position in the mutant.