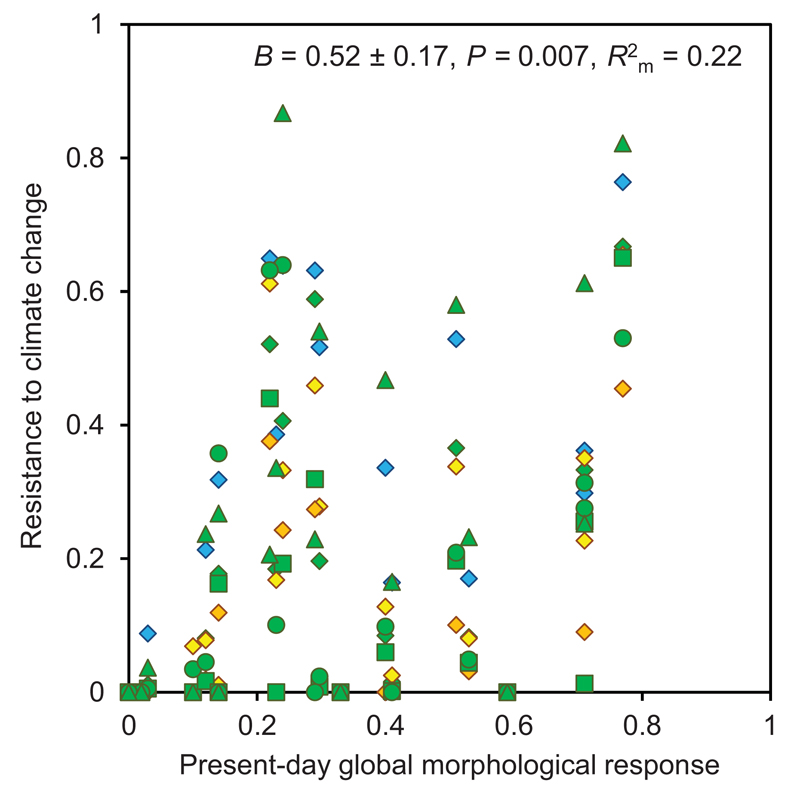
Figure 3.
Relationship between present-day global morphological response (R2c) and resistance to climate change (i.e. the proportion of species range that remains suitable). Different colours and symbols represent distinct emission scenarios and global circulation models, as depicted above the panel.

