
Figure 3.
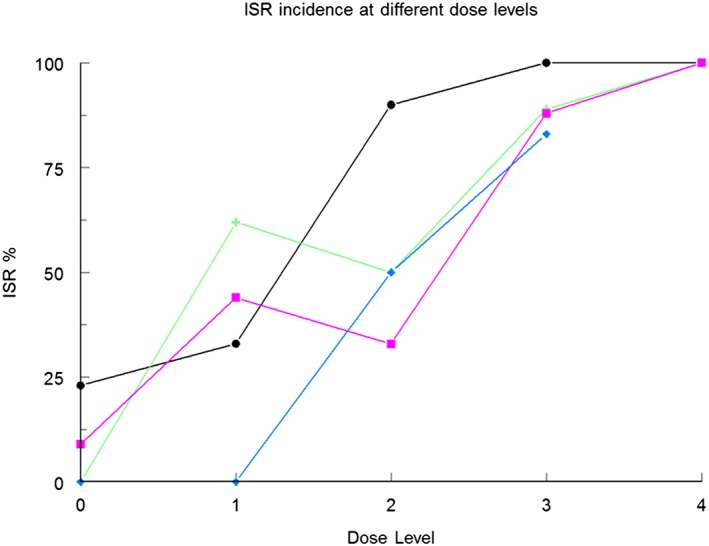
Dose‐dependent occurrence of ISRs after administration of four different ONs. Higher dose levels result in increased incidence of ISRs up to 100% at the highest dose level. The dose levels tested for ( ) ISIS32566 and (
 ) mipomersen 10 were: placebo (0), 50, 100, 200 and 400 mg. For (
 ) IMO‐8400 dose levels were: placebo (0), 0.075, 0.15, 0.3 and 0.6 mg kg−1, and for (
 ) ON_CHDR2 dose levels were: placebo (0), 0.5, 1.5 and 5 mg kg−1