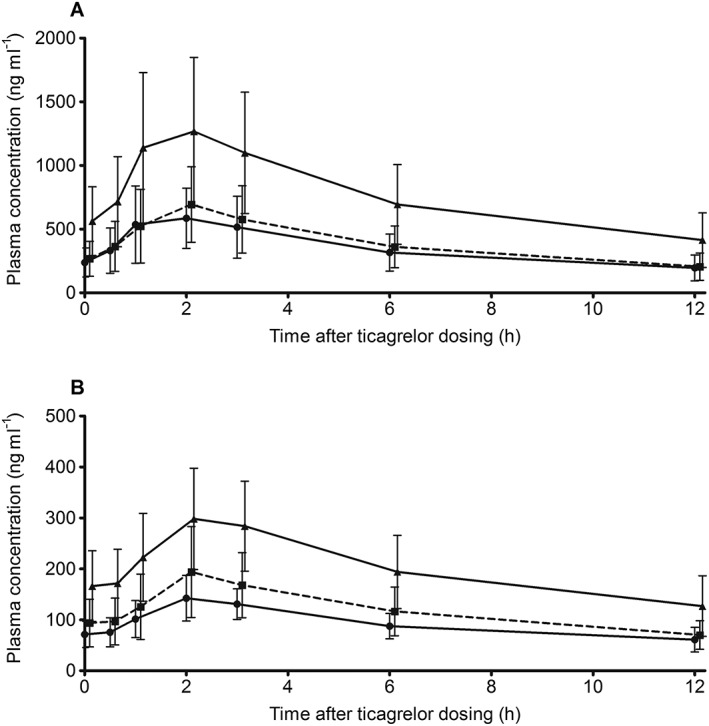
Figure 3.

Mean (± SD) plasma concentrations on day 7 of (A) ticagrelor ( ticagrelor 45 mg (n = 12),
  ticagrelor 60 mg (n = 12),
  ticagrelor 90 mg (n = 12)) and (B) AR‐C124910XX (
 ticagrelor 45 mg (n = 12),
  ticagrelor 60 mg (n = 12) and
  ticagrelor 90 mg (n = 12)) in Chinese patients with stable coronary artery disease treated with low dose aspirin plus ticagrelor 45 mg, 60 mg or 90 mg (single dose on days 1 and 7 and twice daily dosing on days 3–6). Note: data were collected at the time points listed in the Methods section but data points are offset to avoid overlap
