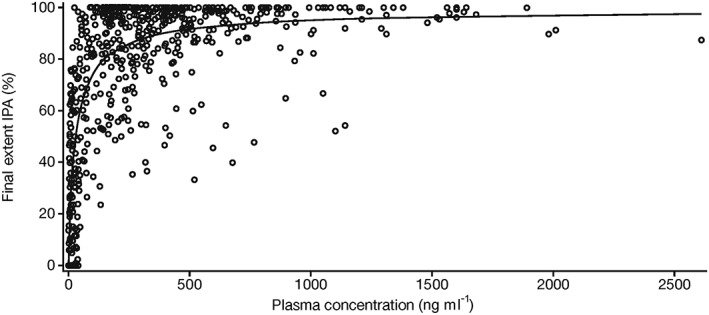
Figure 4.

Scatter plot of ticagrelor plasma concentration vs. final extent IPA in Chinese patients with stable coronary artery disease. The prediction curve shown in the figure is based on a sigmoid Emax model. Emax maximum observed plateau effect; IPA inhibition of platelet aggregation. ( ) Ticagrelor, (
 ) Predicted ticagretor
