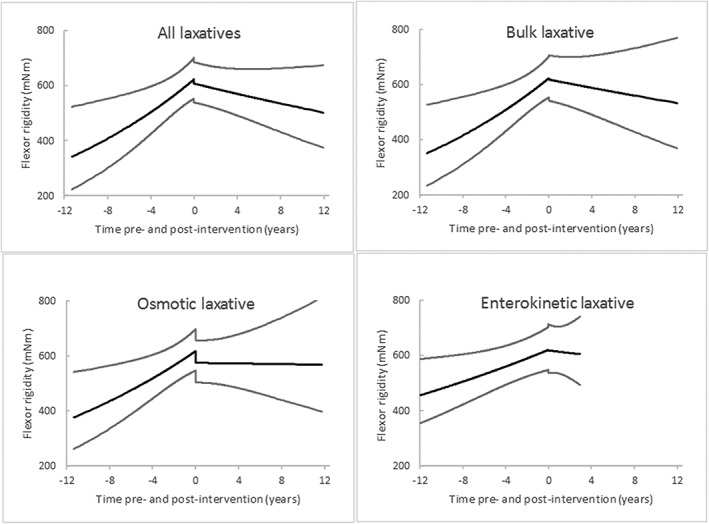
Figure 1.

Time trends and 95% CI in flexor rigidity in relation to initiation of laxative classes at time 0. Of 1493 measurements in 79 patients, post‐intervention time trends are based on 811 measurements (mean 13.5 (SD 10.3) per person) of flexor‐rigidity in 60 receiving any laxative(s), 781 (13.2 (10.3)) in 59 receiving bulk laxative, 686 (12.3 (9.09)) in 56 receiving osmotic laxative, and 191 (7.6 (4.9)) in 25 receiving enterokinetic laxative. Time trends pre‐intervention with any laxative and with bulk, osmotic and enterokinetic laxatives are based on the residual 682, 712, 807 and 1302 measurements, respectively
