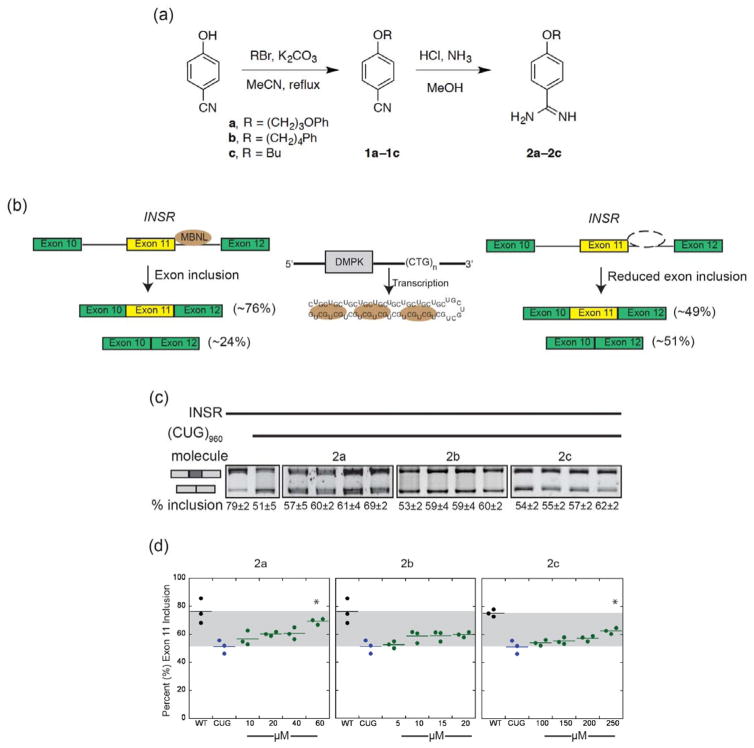
Figure 2. SAR study of pentamidine derivatives.
(a) General synthetic schematic for pentamidine derivatives 2a–2c.
(b) Schematic depicting the effect of CUG repeat RNA on the splicing of INSR. Percentages listed indicate percentage inclusion/exclusion of alternatively spliced exon 11, as quantified in a minigene transfection system.
(c) RT-PCR data of INSR splicing in cells incubated with increasing concentrations of compounds 2a–2c. Results are depicted as average percentage of exon 11 inclusion ± standard deviation of three independent trials.
(d) Jitter plot representation of INSR splicing in cells treated with compounds 2a–2c. Each point is one experiment and the line represents the average of all experiments for that condition (at least three for each concentration). Gray area denotes range between typical splicing and DM1-induced mis-splicing. Concentrations (in μM) are listed below. Asterisks indicate a significant difference between the treatment concentration and mis-splicing without compound.

