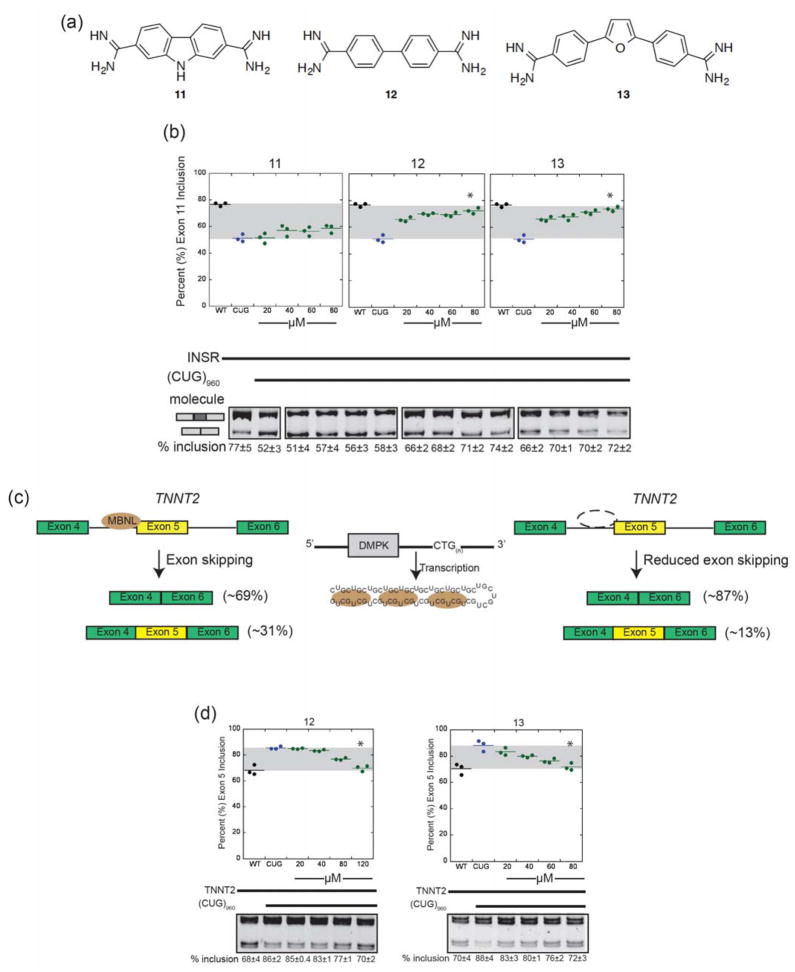
Figure 5. Two conformationally-constrained diamidines (12 and 13) demonstrate decreased toxicity in cellulo.
(a) General synthetic schematic for conformationally-constrained compounds 11–13.
(b) Jitter plot representation of INSR splicing in cells treated with compounds 11–13. Below, representative RT-PCR gels are demonstrated, with average percentage values (± standard deviation) listed per each condition. Asterisks indicate a significant difference between the treatment concentration and mis-splicing without compound.
(c) Schematic depicting the effect of CUG repeat RNA on the splicing of TNNT2. Percentages shown indicate percentage inclusion/exclusion of alternatively spliced exon 11, as quantified in a minigene transfection system.
(d) Jitter plot representation of TNNT2 splicing in cells treated with compounds 12 and 13. Below, representative RT-PCR gels are demonstrated, with average percentage values (± standard deviation) listed per each condition. Asterisks indicate a significant difference between the treatment concentration and mis-splicing without compound.

