
Figure 7.
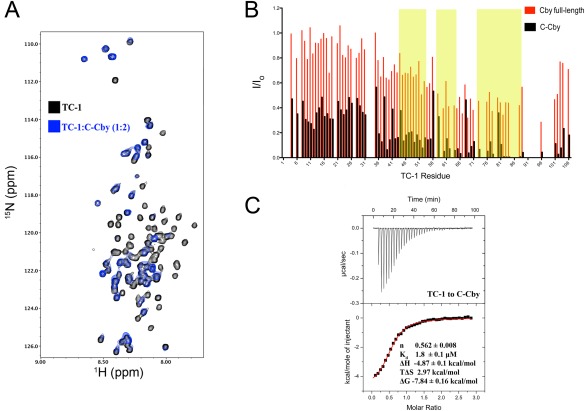
(A) Overlay of 1H‐15N HSQC spectrum of TC‐1 in the absence (black) and presence (blue) of full‐length C‐Cby at a 1:2 ratio (TC‐1 50 μM:C‐Cby 100 μM). (B) Intensity ratios (I/Io) for assigned TC‐1 amide resonances in the presence (I) or absence (Io) of either full‐length Cby (as shown in Fig. 5) or C‐Cby. Yellow shaded areas correspond to the three regions on TC‐1 with high‐helical propensity as determined by chemical shift analysis.8 (C) An ITC thermal profile of TC‐1 binding to C‐Cby. Thermodynamic experimental values are displayed. Kd is the dissociation constant ΔH, ΔS, and ΔG are the change in enthalpy, entropy, and Gibbs free energy upon binding at T = 298 K, respectively.