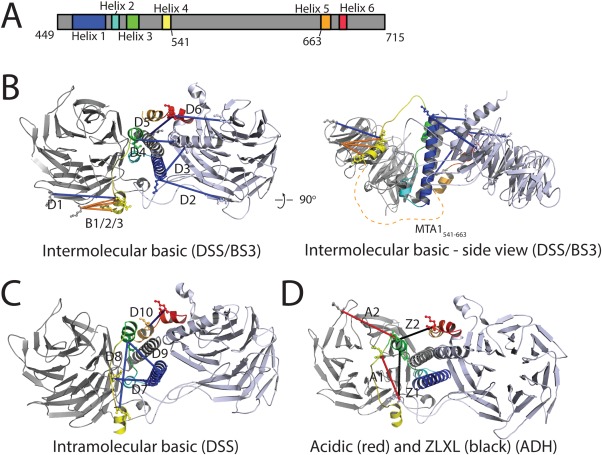
Figure 5.

Proposed model of RBBP4‐MTA1449–715 with associated crosslinking data. A. Schematic of MTA1449–715 showing the predicted helices. Colour coding is used in the rest of the Figure. B–D. Model of the complex. The RBBP4 crystallographic dimer taken from PDB 4PBY is shown in two shades of grey. Modeled MTA1449–715 helices are: Helix 1 (461–488), Helix 2 (also RBM1, 491–499), Helix 3 (505–515), Helix 4 (534–541), Helix 5 (663–671), and Helix 6 (also RBM2, 677–684). A large putative disordered region (541–663) is not included in the model; the position of this region is indicated by a dashed orange line in B (right). Crosslinking data are shown as blue (DSS—basic), red (ADH—acidic), black (ZLXL), and orange (BS3—basic; from (23)) and are labelled accordingly.
