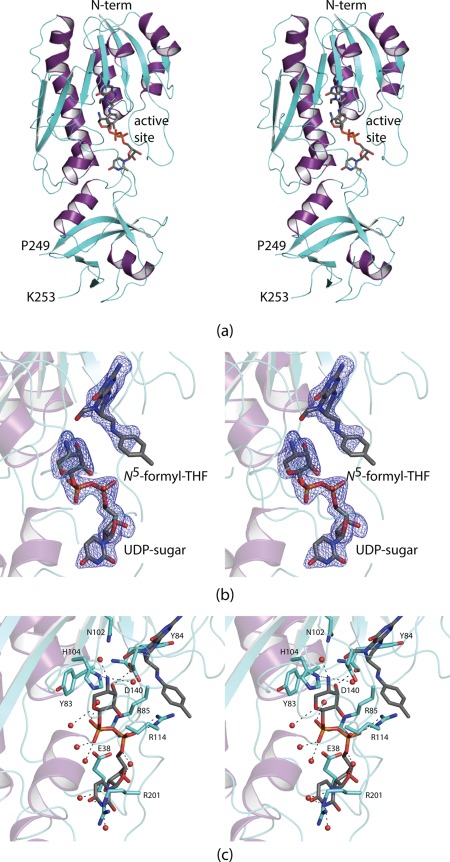
Figure 1.

Structure of the ArnA N‐formyltransferase domain. A ribbon representation of the subunit is shown in (a) with the β‐strands and α‐helices colored in aquamarine and purple, respectively. There is one break in the polypeptide chain backbone between Pro 249 and Lys 253. The bound ligands are displayed in stick representations. Electron density corresponding to the bound ligands is shown in (b). The map, contoured at 3σ, was calculated with coefficients of the form F o−F c, where F o was the native structure factor amplitude and F c was the calculated structure factor amplitude. Although the map was calculated to a nominal resolution of 1.9 Å, because of radiation damage it was only possible to refine the model to an acceptable R‐factor using X‐ray data to 2.5 Å resolution. Note that the ligands were not included in the coordinate file used to calculate the initial map. A close‐up view of the active site is presented in (c). Ordered water molecules are represented by the red spheres. The bound ligands are highlighted in gray bonds. Potential hydrogen bonding interactions are indicated by the dashed lines. All figures were prepared using PyMOL.30
