
Figure 13.
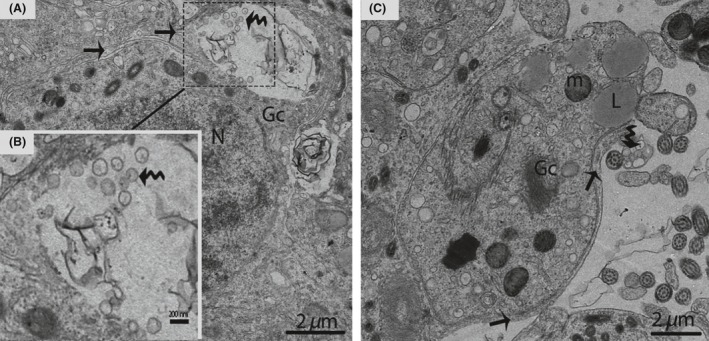
Electron micrograph of exosome secretions in October. The Sertoli cell (arrow) shows the secretion of exosomes (curved arrow) (A). Illustration indicates a magnified view of the exosomes (curved arrow) (B). The exosomes (curved arrow) are enclosed in a membranous structure (C). Gc, germ cell; L, lipid droplet; N, nucleus; m, mitochondria. Scale bar = 2 μm (A), 200 nm (B) and 2 μm (C).