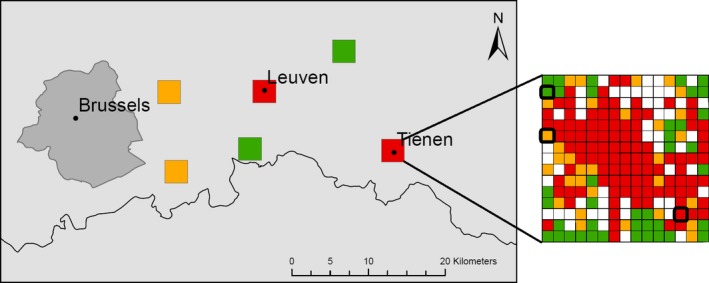
Figure 1.

Map of the study area in central Belgium depicting the six plots. On the right, an example of the different subplots within a given plot, highlighting the three selected subplots in bold. Rural, semiurban, and urban categories are depicted in green, orange, and red, respectively, with white subplots depicting urbanization degrees that fall outside these three urbanization classes. This figure depicts the two spatial scales (i.e., 200 × 200 m and 3 × 3 km) at which urbanization effects were investigated on climatic variables and on the biological fitness of two butterfly species.
