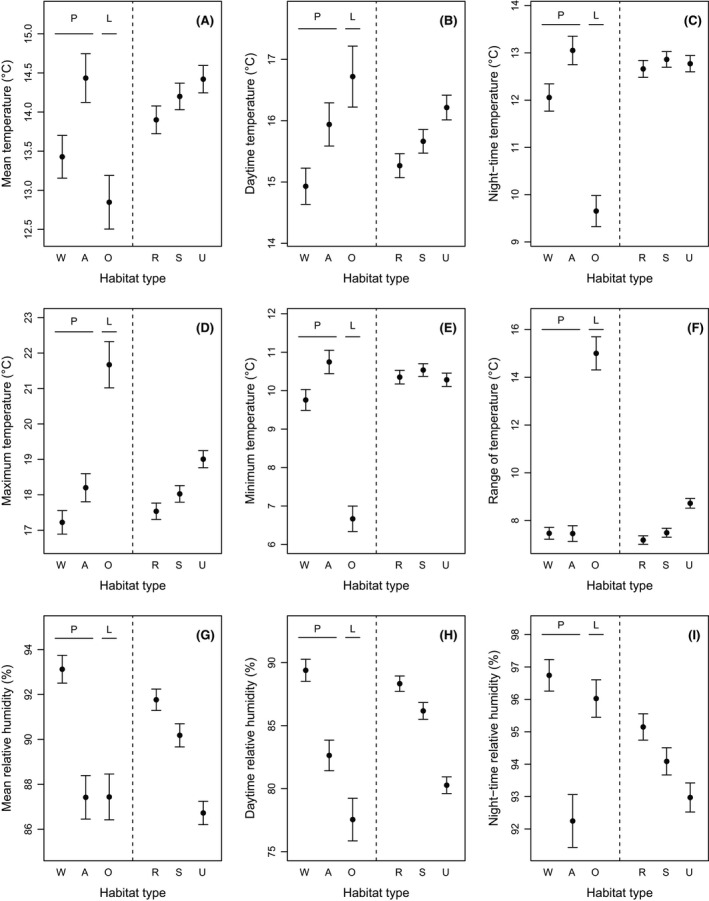
Figure 2.

Effect of habitat type on nine climatic variables. On the left of each panel, W, A, and O stand for Woodland, Agricultural, and Open vegetation, respectively. The former two represent the sites of origin (i.e., reference) for the butterfly P. aegeria (P) whereas the latter represents the sites of origin for the butterfly L. megera (L). On the right of each panel, R, S, and U stand for Rural, Semiurban, and Urban, respectively. These three categories represent different levels of urbanization at the subplot (i.e., local, 200 × 200 m) scale. For each climatic variable, we show mean values (±SE).
