Figure 2.
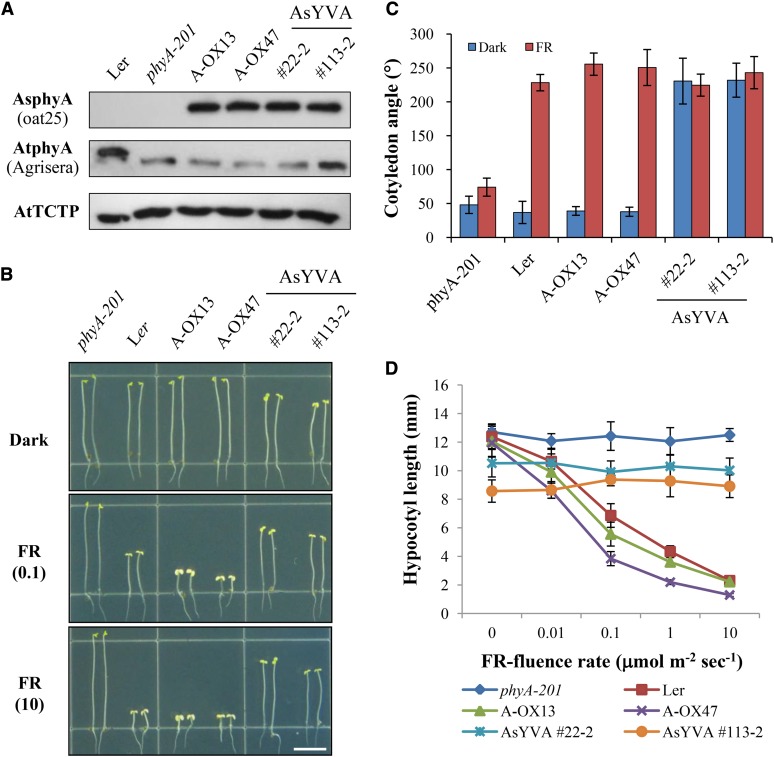
Transgenic plants with AsYVA exhibit a weak cop phenotype. A, Immunoblot analysis to show the protein levels of AsphyA and AtphyA in transgenic plants. phyA-201, PhyA-deficient Arabidopsis (Ler ecotype); A-OX, transgenic phyA-201 lines overexpressing wild-type AsphyA; AsYVA, transgenic phyA-201 lines with Y268V-AsphyA. Numbers represent independent homozygous lines. AsphyA-specific (oat25), AtphyA-specific (Agrisera), or AtTCTP-specific antibody was used for the immunoblots. The lower bands in the immunoblot for AtphyA represent truncated AtphyA proteins in phyA-201 that were used for transformation. AtTCTP is shown as loading control. B, Hypocotyl de-etiolation of representative seedlings grown under continuous FR light conditions. The numbers 0.1 and 10 in parentheses are the fluence rates (µmol m−2 s−1) used in the analysis. Scale bar = 5.0 mm. C, Average cotyledon angles of seedlings grown in the dark or continuous FR light (10 µmol m−2 s−1). Data are the means ± sd (n ≥ 30). D, FR fluence rate response curves for the inhibition of hypocotyl growth. Data are the means ± sd (n ≥ 30).

