Figure 5.
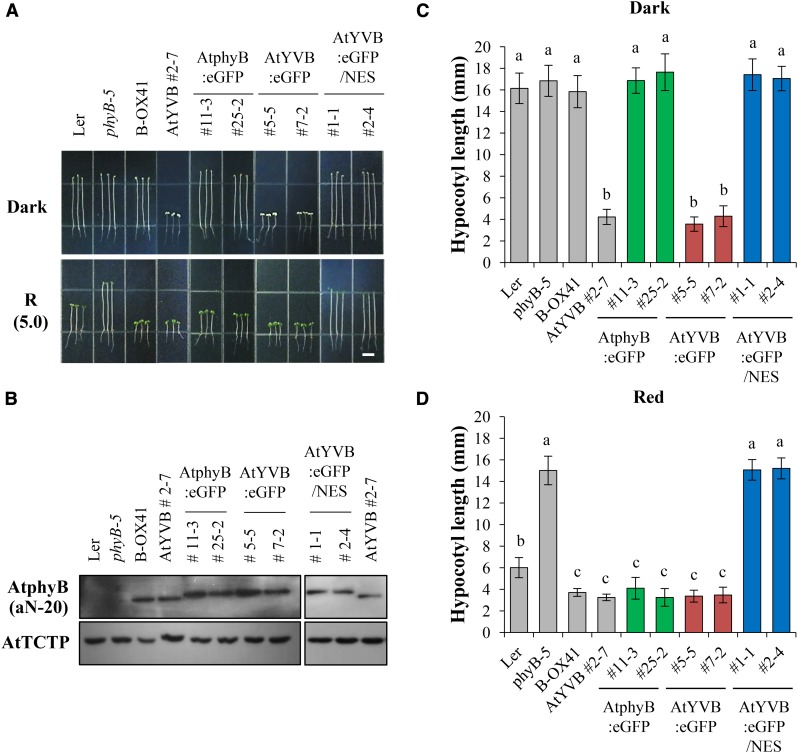
Photoresponse analysis of transgenic plants with NES-fused AtYVB. A, Seedling de-etiolation responses under dark or continuous R light (5.0 μmol m−2 s−1). AtphyB:eGFP, Transgenic phyB-5 lines with eGFP-fused wild-type AtphyB; AtYVB:eGFP, transgenic phyB-5 lines with eGFP-fused Y303V-AtphyB; AtYVB:eGFP/NES, transgenic phyB-5 lines with NES-fused AtYVB:eGFP. Numbers represent independent homozygous lines. Scale bar = 5.0 mm. B, Immunoblot analysis to show AtphyB protein levels in transgenic plants. Loading controls (AtTCTP) are shown in the bottom panel. C and D, Average hypocotyl lengths of seedlings in A. Data are the means ± sd (n ≥ 25). Means with different letters are significantly different at P < 0.01, using Duncan’s multiple range test.

