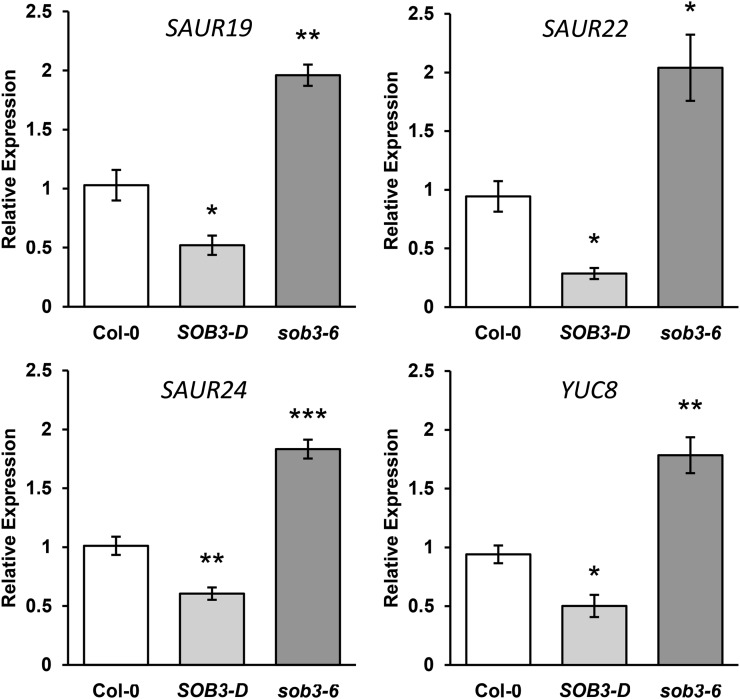
Figure 1.
Auxin-associated genes are repressed in SOB3-D but induced in sob3-6 at 4 d. Relative expression is shown for genes associated with auxin signaling in Col-0 and homozygous SOB3-D and sob3-6 seedlings, as determined by qRT-PCR. Transcript levels are normalized based on the expression of the MDAR4 housekeeping gene. PCR was performed in triplicate, and average expression values were calculated and used for analysis. All values are shown as fold change compared with the wild type. Error bars represent se from four biological replicates. In a Welch’s t test (unpaired two-tailed t test with unequal variance) compared with the wild type, *, P < 0.05; **, P < 0.01; and ***, P < 0.001.

