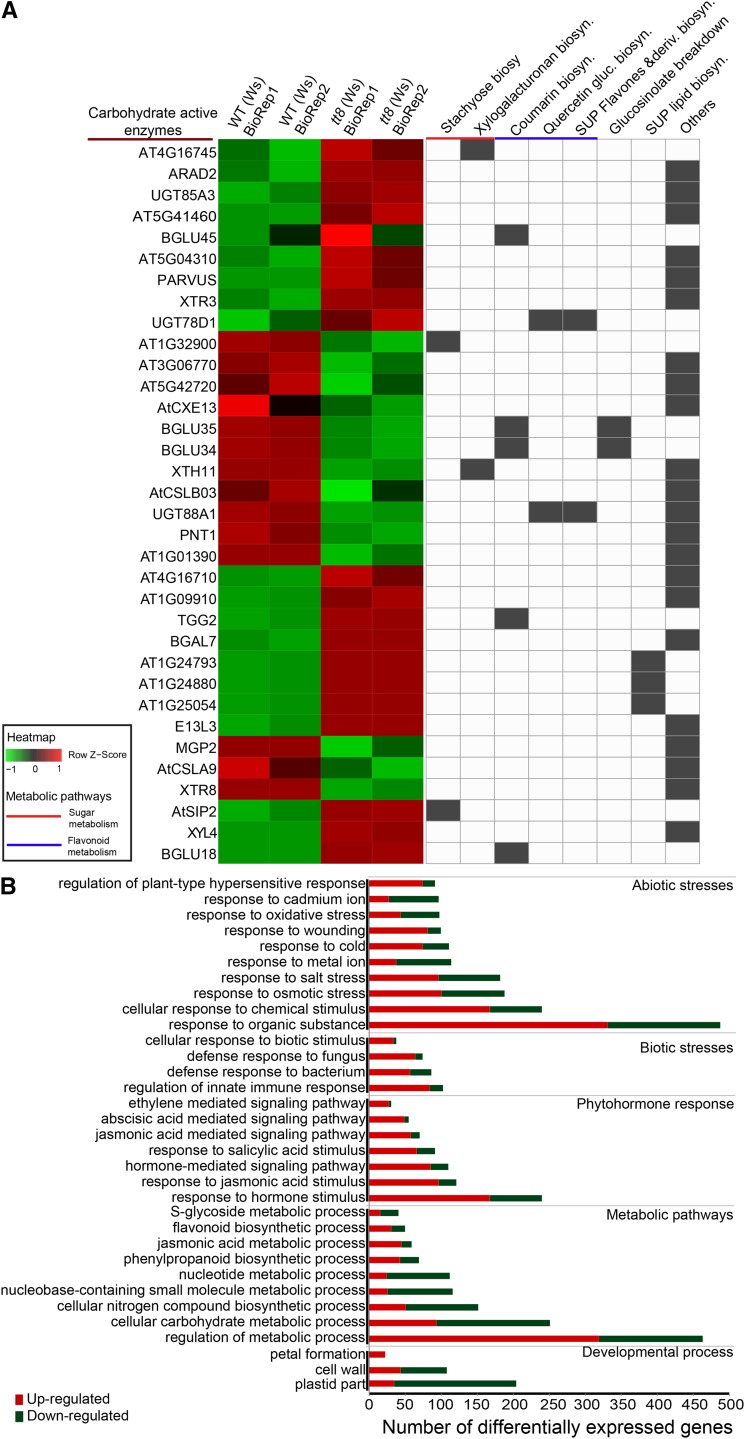
Figure 2.
CAZy and stress response-associated gene ontology categories enriched in tt8. A, Heatmap on the left shows relative levels of differential gene abundances classified under CAZy, with absolute fold change > 2 and FDR < 0.05, and computed as z-scores using heatmap2 function in R. Each row represents a gene and column an average of the two replicates each of tt8 (Ws) and WT (Ws) in each slide. In the matrix on the right, each column represents a pathway from AraCyc, with the presence of a gene in that pathway shown in gray. Fourteen out of 34 genes belong to sugar, flavonoid, or hormone biosynthesis. Genes not classified under these pathways were annotated as others. B, Gene set enrichment analysis was performed on 1,284 differentially expressed genes using the PlantGSEA tool. The top 33 enriched gene ontology categories (FDR < 0.05) with the number of differentially expressed genes affected in each category are shown here. Within each of the enriched gene ontology categories, the number of up- and down-regulated genes are shown in red and green, respectively.

