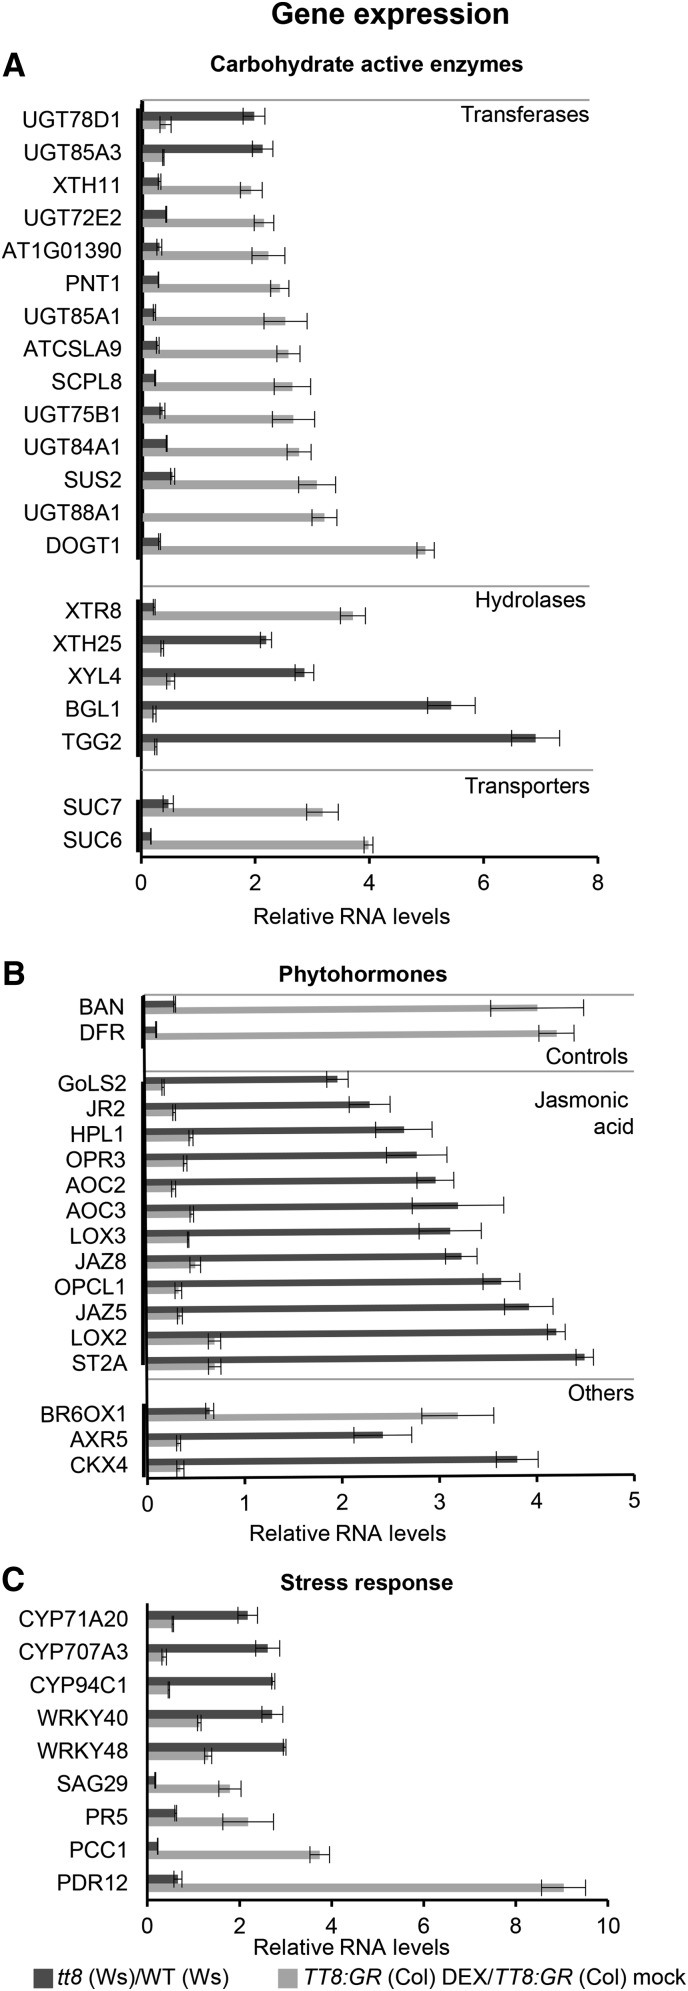
Figure 5.
Validation of TT8 glycosylation regulome members using mutant and inducible overexpression lines. From the glycosylation regulatory network, 18 CAZy with top 3 enriched processes, 13 phytohormone-associated genes, and nine stress response-associated genes showed reciprocal expression levels in tt8 (Ws) and its DEX-induced TT8:GR (Col) overexpression lines. Relative transcript levels of genes were quantified using real-time PCR normalized against tubulin2 as control. Shown are genes associated with CAZy (A), phytohormone biosynthesis (B), and stress response (C). Light and dark gray bars represent relative transcript levels in TT8:GR (Col) DEX/TT8:GR (Col) mock and tt8 (Ws)/WT (Ws), respectively. Results are shown as mean ± se based on three replications (P < 0.05).

