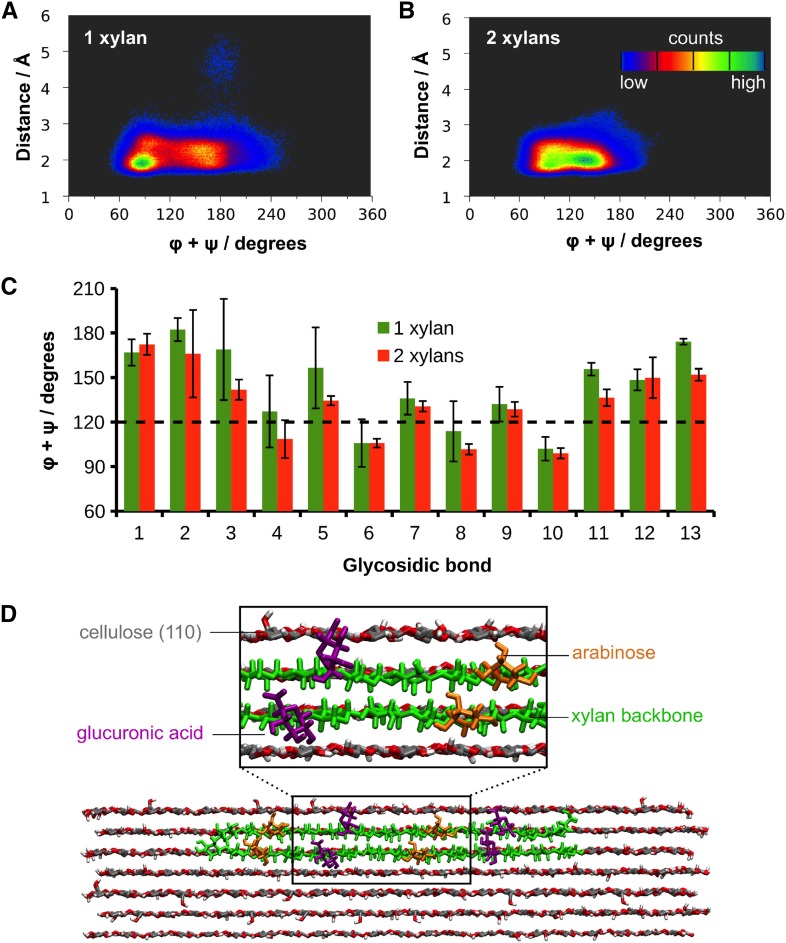
Figure 12.
Molecular dynamics simulations of cellulose-xylan complexes. Two-dimensional distribution of the sum of dihedral angles φ+ψ of xylosyl residues against their distances from the cellulose surface for one (A) and two (B) conifer xylans. The two xylosyl residues at both ends of the xylan chain were not considered in the analysis. C, Average values of φ+ψ for each glycosidic bond of the xylan backbone. The error bars correspond to the standard deviations of the averages taken from the three independent simulations. D, Snapshot taken from the simulation of two xylans adsorbed on the (110) face of the cellulose fibril, showing the extended configuration of the chain.

