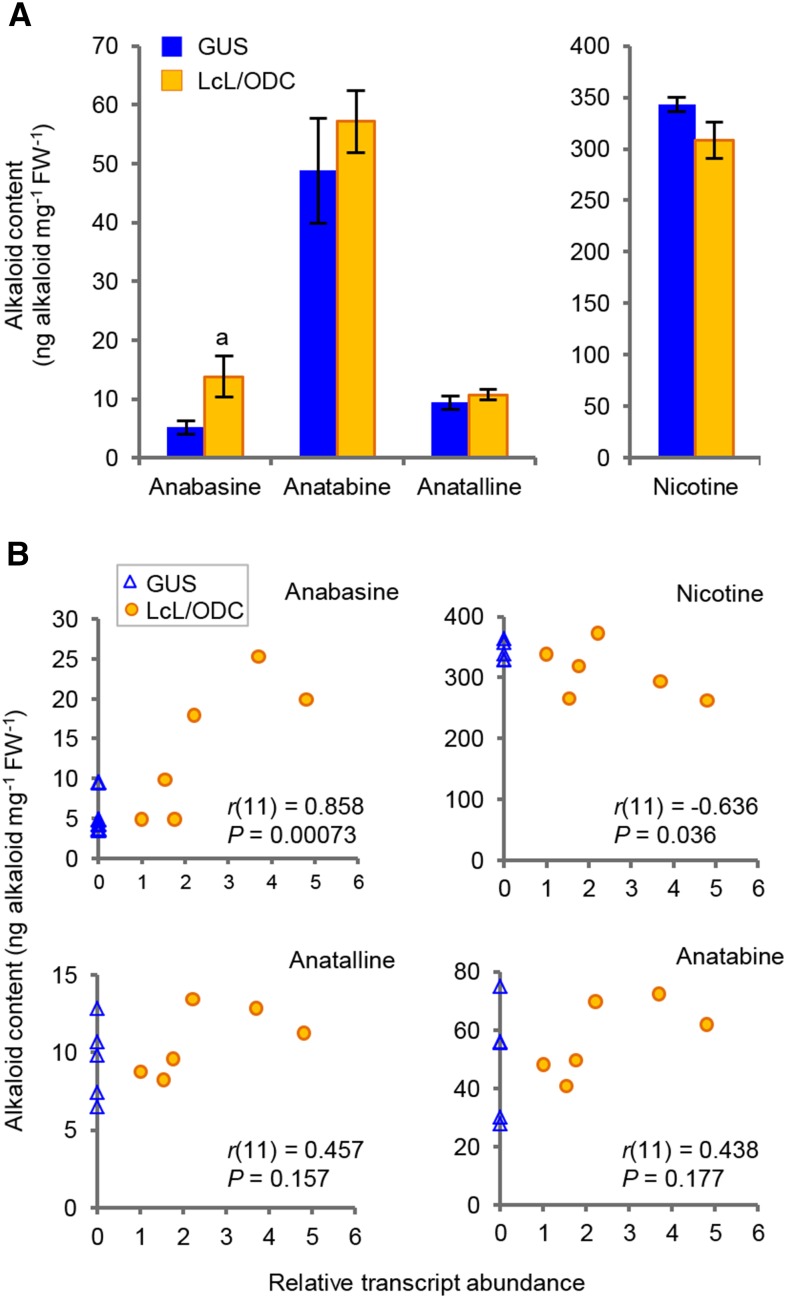
Figure 3.
Major alkaloid levels and correlations between the relative abundance of LcL/ODC transcript and the alkaloid levels in tobacco hairy roots overexpressing LcL/ODC. A, Abundance of tobacco alkaloids in six and five independent hairy roots for LcL/ODC- and GUS-overexpressing lines, respectively (biological replicates, n = 4 for each line). Values are means ± se. Lowercase a indicates that the mean value is statistically different from the corresponding GUS control, based on a one-tailed Student’s t test: P < 0.05. B, Correlations between each of the tobacco alkaloids and the relative LcL/ODC transcripts in tobacco hairy roots overexpressing LcL/ODC (orange circles) and GUS (blue triangles) lines. Pearson correlation coefficients (r) with the number of tested samples in parentheses and the corresponding P values are shown. FW, Fresh weight.

