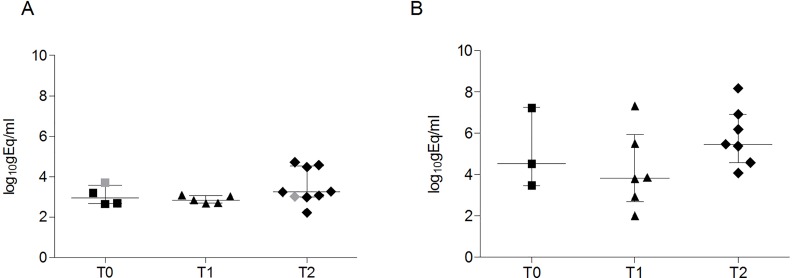
Fig 3. JCV-DNA viral loads.
(A) Blood viral load of RRMS patients who resulted positive for JCV-DNA detection at T0 (4/16), T1 (5/26), and T2 (9/26). Symbols in gray represent subjects with JCV-DNA positivity only in PBMC, while plasma resulted negative. No statistical differences were found (one-way ANOVA test for non-parametrical data, Kruskal-Wallis). Results were expressed as log10gEq/ml for plasma, and log10gEq/106 cells for PBMC. Data are shown as median (lines) and interquartile ranges (whiskers). (B) Urine viral load of the RRMS patients who resulted positive for JCV-DNA detection at T0 (3/16), T1 (6/26), and T2 (7/26). No statistical differences were found (one-way ANOVA test for non-parametrical data, Kruskal-Wallis). Results were expressed as log10gEq/ml. Data are shown as median (lines) and interquartile ranges (whiskers).

