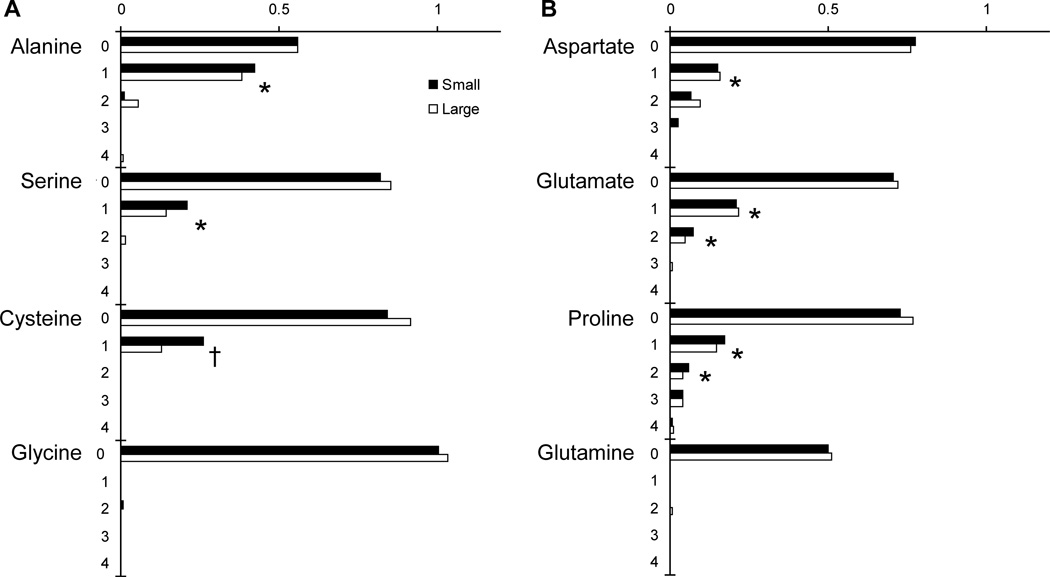
Figure 5.
Isotopomer distribution for non-essential amino acids produced from (A) glycolysis and (B) TCA-cycle metabolites. Ordinate labels indicate mass number. Singly labeled species (1, M+1) were observed for alanine, serine, cysteine, aspartate, glutamate and proline; and doubly labeled species (2, M+2) were observed for glutamate and proline (†, P<0.05; *, P<0.01; n=4).

