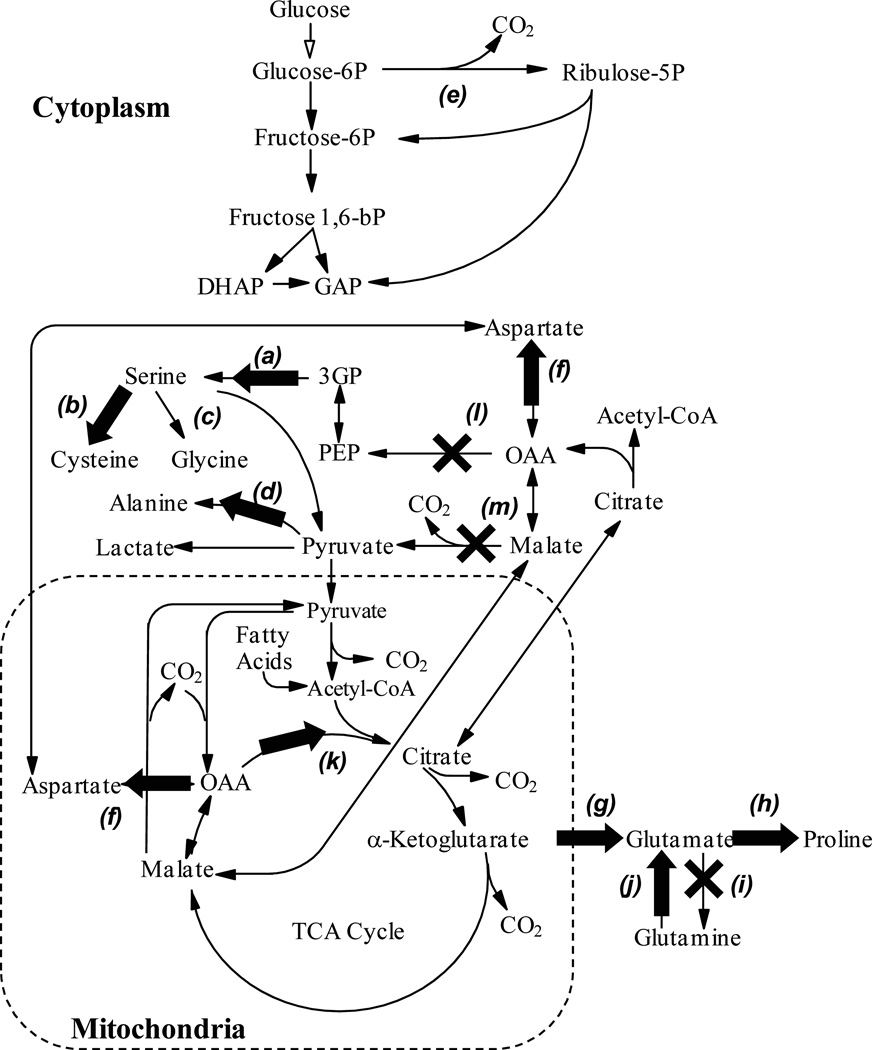
Figure 6.
Metabolic pathway model, which contains glycolysis, the TCA cycle and some biosynthetic pathways. Labeled pathways are: a) serine synthesis, b) cysteine synthesis, c) glycine synthesis, d) alanine synthesis, e) the pentose phosphate pathway, f) aspartate synthesis, g) glutamate synthesis, h) proline synthesis, i) glutamine synthesis, j) glutamine degradation, k) citrate synthase, l) phosphoenolpyruvate carboxykinase, and m) malic enzyme. Active and inactive pathways are indicated with arrows and X’s, respectively.

