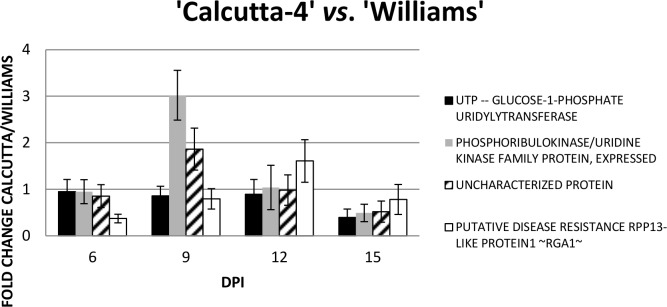
Fig 8. Gene expression analysis in a second greenhouse bioassay.
Relative quantification was performed using RT-qPCR in three biological replications independently. Fold changes is the ratio of gene expression of the inoculated ‘Calcutta-4’ and ‘Williams’ compared to the gene expression of the inoculated ‘Williams’.

