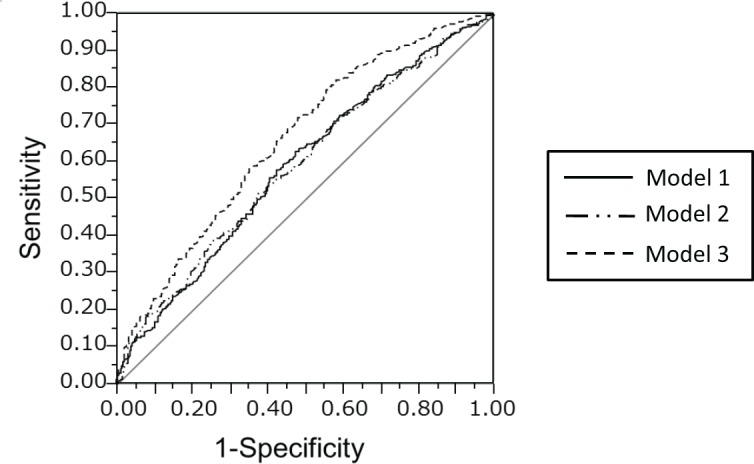
Fig 3. Receiver operating characteristic (ROC) curves for the multiple logistic regression models for low back pain.

The area under the curve (AUC) for the ROC curves for models 1, 2, and 3 were 0.59, 0.60, and 0.66, respectively. The AUC for model 3 was significantly greater than the AUCs for models 1 and 2.
