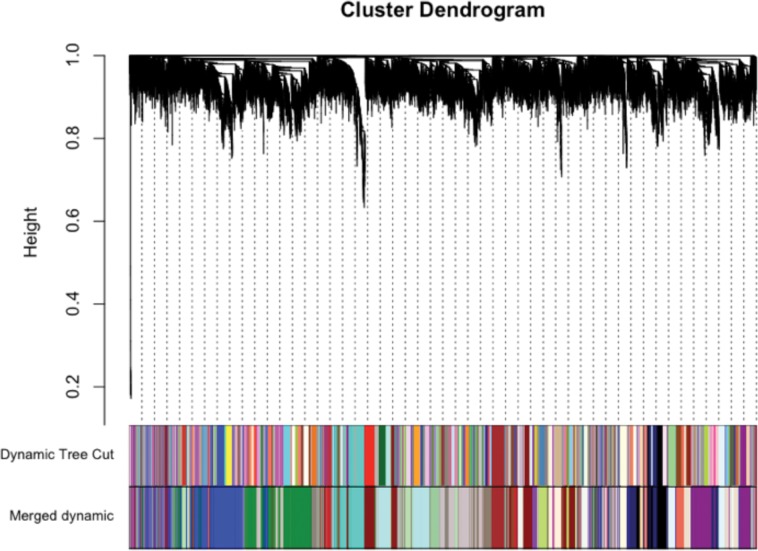
Fig 3. Shown are all 13,301 genes (individual black lines at top) clustered by their topological overlap dissimilarity scores.
The multi-colored panel next to “Dynamic Tree Cut” shows 122 identified modules using the Dynamic Tree Cut algorithm. The second multi-colored panel shows 37 larger modules identified after highly correlated smaller modules were merged together.

