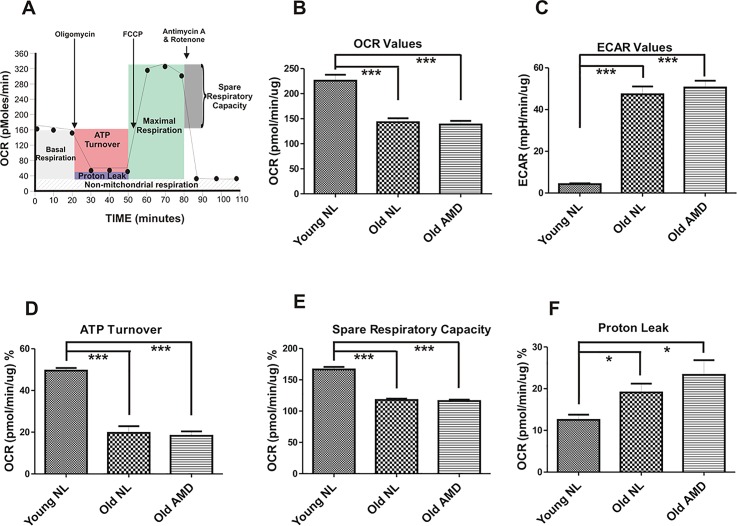
Fig 3. Bioenergetic profiles for Normal and AMD cybrids.
(A) Representative bioenergetic profile measured by the Seahorse XF24 flux analyzer. This figure shows OCR and ECAR patterns after sequential treatment with oligomycin (1 μM), FCCP (1 μM) and Antimycin A plus Rotenone (1 μM), demonstrating the regions that define basal aerobic respiration, ATP turnover, maximal respiration, and spare respiratory capacity. (B), (C), (D), (E), (F) Graphs comparing the OCR, ECAR, ATP turnover, spare respiratory capacity, and proton leak values, respectively, in Young-Normal (NL), Old-Normal, and Old-AMD cybrids. These data are presented as a percent response from the basal readings, with non-mitochondrial respiration subtracted out and the basal respiratory rate normalized to 100%.

