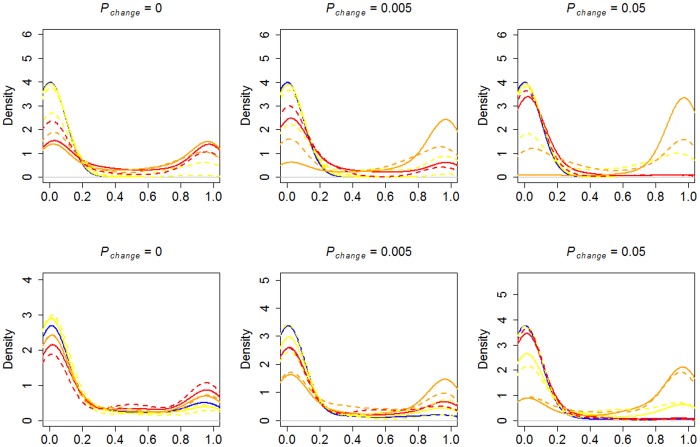
Fig 1. Phenotypic frequency densities without (top) and with (bottom) preparedness.
Density plot for the phenotypic frequency at the end-point (time step 50000) for the different strategies over 100 simulation runs. Solid lines: Danger > 0. Dotted lines: Danger = 0. Blue = Asocial learning (O0,T0), yellow = observational learning (O1,T0), red = parental learning (O0,T1), orange = advanced social learning (O1,T1).

