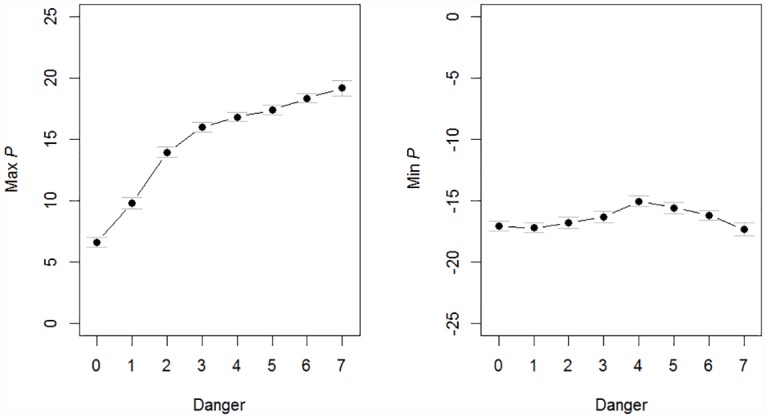
Fig 3. Preparedness as a function of environmental danger.

Average max and minimum values of the preparedness vector regulating innate approach/avoidance tendencies averaged over all levels of Pchange. The means are derived from averaging time-step 25000–50000 for 100 repeats of each simulation. The standard errors are calculated across the 100 runs.
