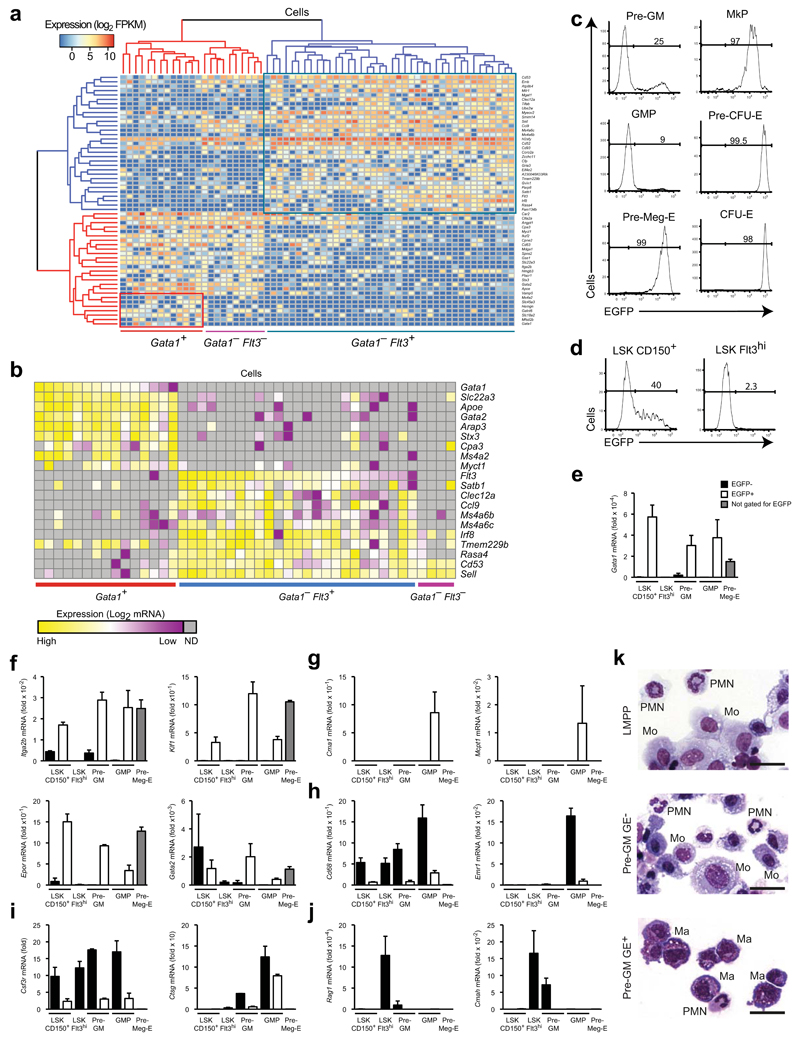
Figure 1. Gata1 expression identifies distinct myeloid progenitor subsets.
(a) Hierarchical clustering of single pre-GM cells using the gene set from Supplementary Figure 1b. The major molecularly distinct cell clusters are labeled according to Gata1 and Flt3 expression. (b) Heatmap showing expression of genes selectively expressed between the 3 clusters from (a) in single pre-GMs. Expression values were normalized to Hprt expression and shown as deviation from mean expression value of each individual gene. Cells were grouped according to descending Gata1 and Flt3 expression. (c) EGFP expression in pre-GM, GMP, pre-Meg-E, MkP, pre-CFU-E and CFU-E populations from Gata1-EGFPtg/+ adult bone marrow. The percentage of EGFP positive cells is indicated. Gates were set based on wild type cells. Gating strategy for the populations is depicted in Supplementary Figure 1d. (d) EGFP expression in LSKCD150+Flt3− and LSKFlt3hi cells. Gating strategy for populations is depicted in Supplementary Figure 1e. (e-j) Quantitative PCR analysis of mRNA expression relative to Hprt of Gata1 (e), genes associated with megakaryocytes/erythrocytes (f), mast cells (g), monocytes-macrophages (h), neutrophils (i) and lymphoid cells (j) in purified stem- and progenitor populations. (k) Representative morphology of cells from day 8 of cultures of LMPPs, pre-GMs GE- and pre-GMs GE+. Monocytes (Mo), polymorphonuclear granulocytes (PMN), and mast cells (Ma) are indicated. Scale bars: 25μm. Analysis representative of 20 (c) and 5 (d) independent experiments is shown. Gene expression is mean ± s.e.m, n=3 biological replicates, except n=2 for pre-GM EGFP- (e-j).

