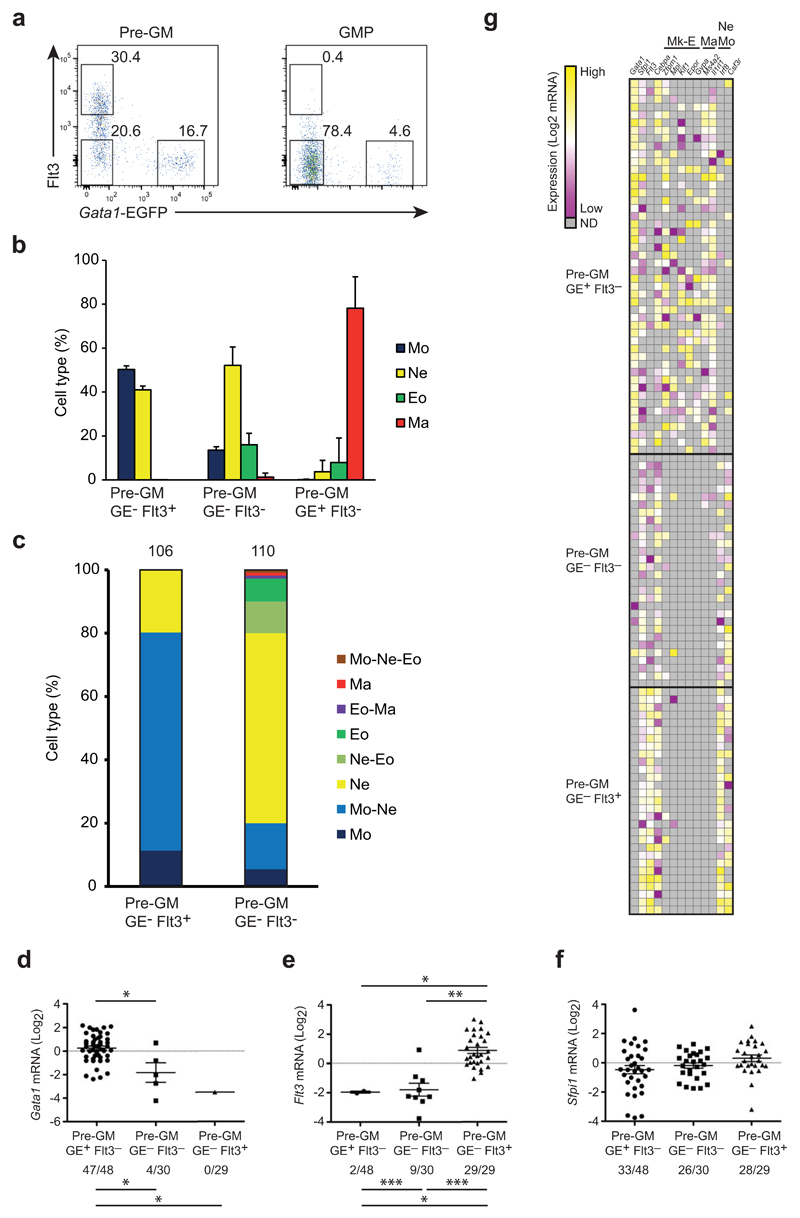
Figure 7. Flt3 expression subdivides the pre-GM GE- population.
(a) FACS profiles showing Flt3 and EGFP expression in pre-GMs and GMPs from Gata1-EGFPtg/+ BM. Numbers indicate percentage of cells within each gate. (b) 100 cells of indicated pre-GMs were grown for 8 days and cell type was analyzed as in Fig. 4a. and shown as percentage of analyzed cells. (c) Single pre-GMs were grown for 8 days under pan-myeloid conditions and cytospins stained as in Fig. 4d. Cell types are shown as percentage of total analyzed clones, indicated on top of bars. (d-f) Gata1 (d), Flt3 (e) and Spfi1 (f) expression in single cells of indicated progenitors, shown as mRNA (Log2), normalized to Hprt and deviated from the mean. Numbers below graphs indicate cells positive for respective gene expression out of total number of cells. (g) Heatmap showing expression of genes including megakaryocyte/erythrocyte (Mk-E), mast cell (Ma) and neutrophil-monocyte (Ne Mo) related genes in single pre-GMs. Values were normalized to Hprt and shown as deviation from mean of each individual gene. FACS plots are representative for 10 independent experiments (a). Percentage of cell type (b) is mean ±SD from 12 (Pre-GM GE-Flt3+ and Pre-GM GE-Flt3-) and 7 (Pre-GM GE+Flt3-) biological replicates from 2 experiments. Analyzed clones (c) are accumulated from 2 independent experiments. Mann-Whitney U-test was used for expression levels (above graphs), Fisher’s exact test was used to compare expression frequencies between population (below graphs) (*p<0.0001, **p=0.001, ***p=0.002) (d).

