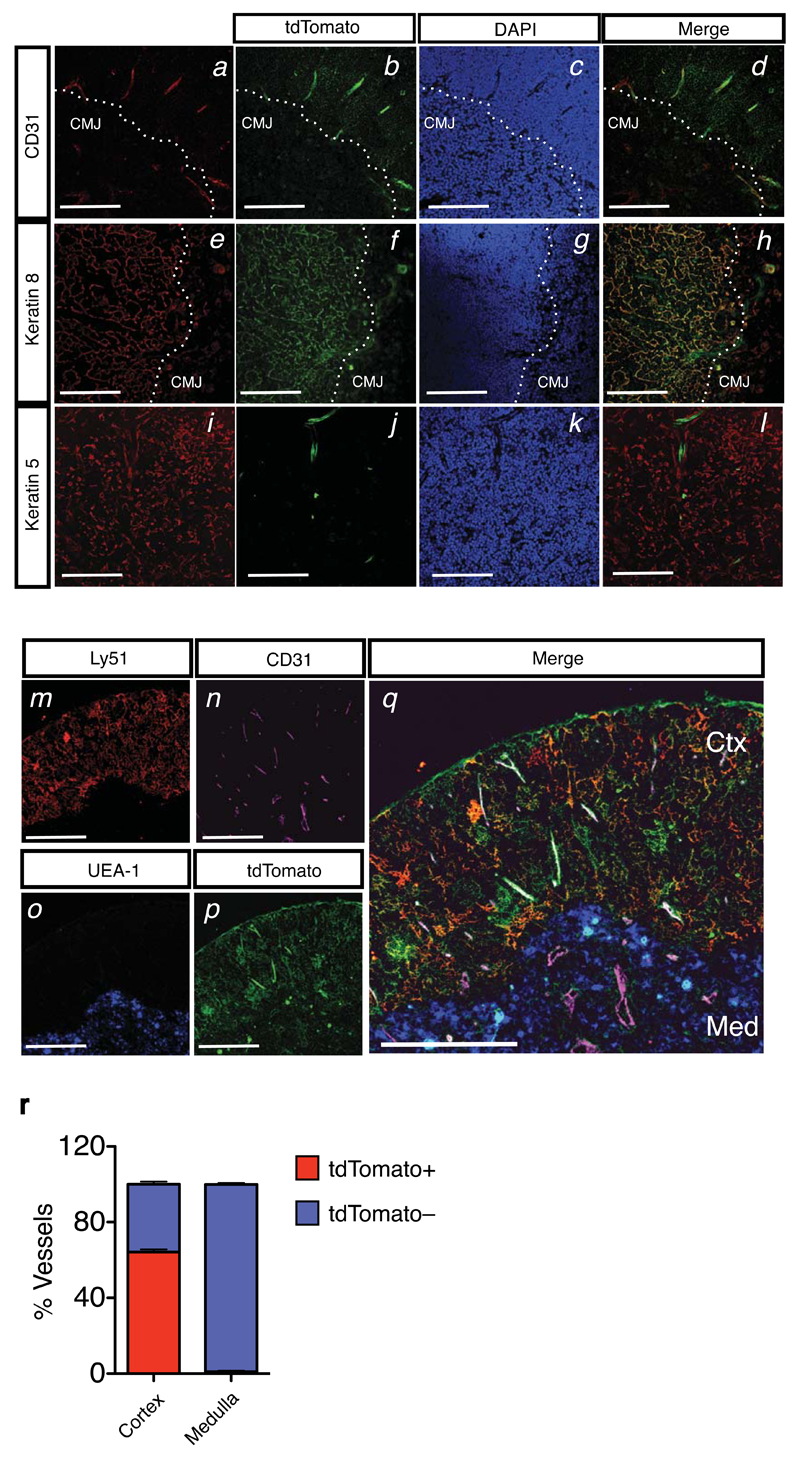
Figure 2. Localization of Kit ligand expressing thymic stromal subsets to the cortico-medullary junction and cortex.
(a-d) Immunofluorescence analysis of Kitl-tdTomatotg/+ thymic section using antibodies against CD31 (panel a, red), and tdTomato (panel b, green). DAPI staining was used to identify the cortico-medullary junction (CMJ). Colocalization of CD31 and tdTomato is shown (panel d). Scale bars: 300μm.
(e-h) Analysis as in (a-d), using anti-K8 (panel e, red) and anti-tdTomato (panel f, green) antibodies. Scale bars: 300μm.
(i-l) Analysis as in (a-d), using anti-K5 (panel i, red) and anti-tdTomato (panel j, green) antibodies. Scale bars: 300μm.
(m-q) Immunofluorescence analysis of Kitl-tdTomatotg/+ thymic section using antibodies against Ly51 (panel m, red), CD31 (panel n, pink), UEA-1 (panel o, blue), tdTomato (panel p, green). Colocalization is shown (panel q). Note the preferential location of tdTomato+CD31+ VECs to the cortex (Ctx), whereas medullary (Med) VECs (CD31+) are tdTomato–. Scale bars: 300μm.
(r) Quantification of the tdTomato+CD31+ and tdTomato–CD31+ VECs across the cortical and medullary regions. Result shown as average percentage of the total vascular structures counted in the cortical region (n=1475) and medulla (n=341) from 3 biological replicates and 2 separate experiments. Bars show the SEM.

