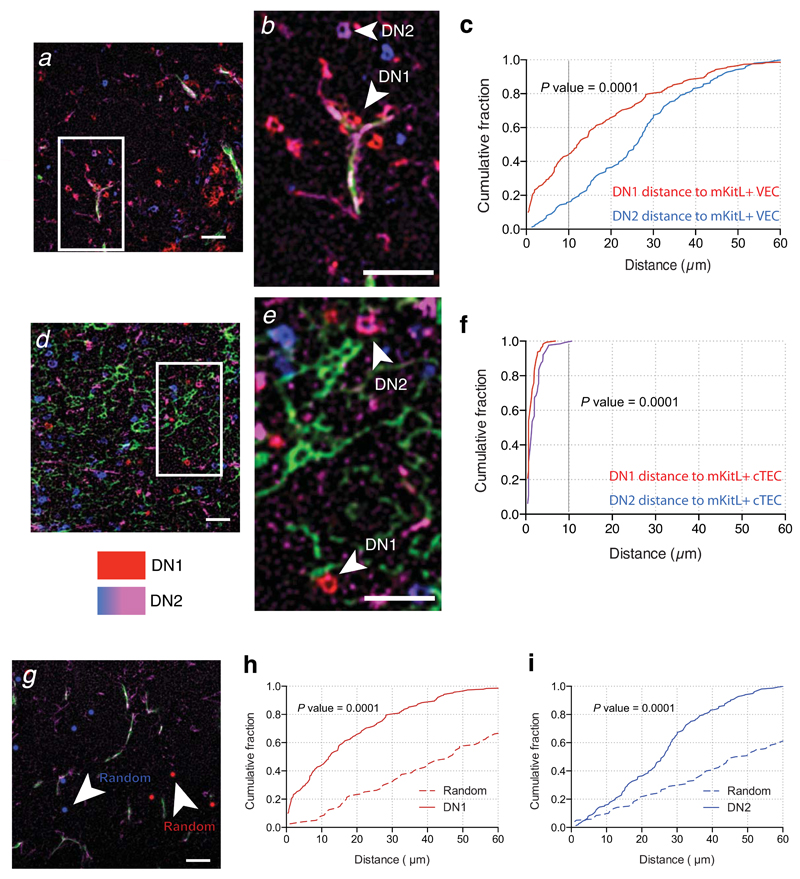
Figure 4. c-Kit+ thymocyte progenitors home to mKitL expressing cortical VECs and TECs.
(a) Immunofluorescence analysis thymic sections using antibodies against CD31 (green), intracellular KitL+ (ICKitL; pink), c-Kit (red) and CD25 (blue) to identify mKitL+ VECs (CD31+ICKitL+) and c-Kit+ thymocyte progenitors (DN1: c-Kit+CD25–; DN2: c-Kit+CD25+). Scale bar: 100μm
(b) Insert from (a) showing mKitL+ VEC-associated DN1 thymocyte (arrowhead) and DN2 thymocyte (arrow) indicated. Scale bar: 100μm
(c) Distribution of the distances between ICKitL+ VECs and DN1 and DN2 thymocytes measured from sections stained as in (a). The plot shows the cumulative fraction of cells closer than the indicated distance. The significance of the difference in distance distribution between DN1 and DN2 thymocytes was calculated using the Kolmogorov-Smirnov test. DN1: N=189; DN2: N=153 from 3 biological replicates.
(d,e) Analysis as in (a,b) using antibodies against against Ly51 (green), ICKitL (pink), c-Kit (red) and CD25 (blue) to identify mKitL+ cTECs (Ly51+ICKitL+) and c-Kit+ thymocyte progenitors (DN1: c-Kit+CD25–; DN2: c-Kit+CD25+). Scale bars: 100μm
(f) Analysis as in (c) of the distances between ICKitL+ VECs and DN1 and DN2 thymocytes measured from sections stained as in (d). DN1: N=158; DN2: N=127 from 3 biological replicates.
(g) Immunofluorescence analysis of thymic sections with antibodies against CD31 (green), intracellular KitL (pink) (used to generate data in (a)) was used as a platform to generate a random distribution of DN1 and DN2 cells. The original DN1 and DN2 cell staining was removed and replaced with randomly distributed red (DN1) and blue (DN2) dots that resembled the size and the in vivo frequency for these cells.
(h) Distribution of the distances between ICKitL+ VECs/DN1 vs ICKitL+ VECs/Random. The significance of the difference in the distance distribution was calculated using the Kolmogorov-Smirnov test. P value is shown. DN1: N=189 (from panel c); Random: N=80.
(i) Distribution of the distances between ICKitL+ VECs/DN2 vs ICKitL+ VECs/Random. The significance of the difference in the distance distribution was calculated using the Kolmogorov Smirnov test. P value is shown. DN2: N=153 (from panel c); Random: N=120.

