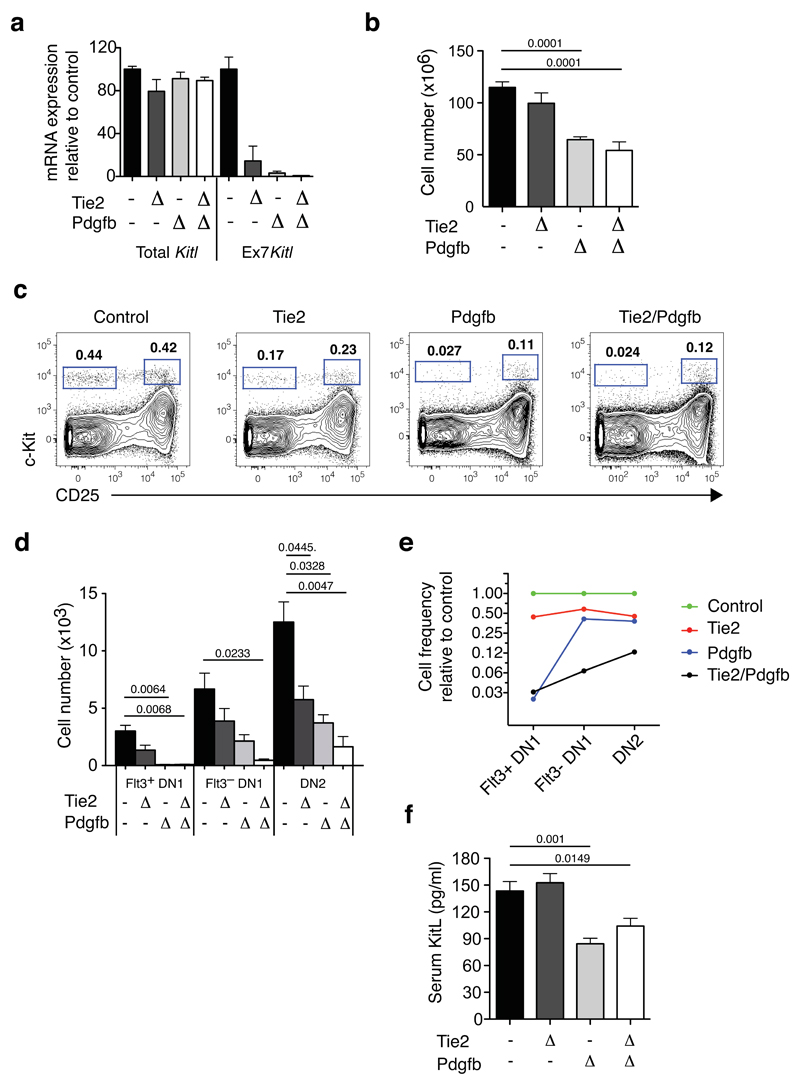
Figure 5. Cortical vascular expression of mKitL is critical for thymocyte progenitor homeostasis.
(a). qPCR analysis of KItl mRNA levels using Kitl exon 2-3 spanning (Total Kitl) and exon7-8 (Ex7 Kitl) spanning amplicons was performed on sorted thymic VECs from Control (KitlLEx7/LEx7; n=10), Tie2ΔEx7 (n=4), PdgfbΔEx7 (n=5) and Tie2/PdgfbΔEx7 (n=6) mice, collected from 5 independent experiments. To induce Pdgfb-CreERT2–mediated deletion, mice were injected twice with 3mg tamoxifen with a 2-day interval, and analyzed 7 days after the last injection, at 4-5 weeks of age. Values shown are average expression as percentage of the control value; error bars indicate standard errors. For source data see Supplementary Table 5.
(b) The number of total thymocytes in 4-5 weeks old Control (KitlLEx7/LEx7; n=20), Tie2ΔEx7 (n=7), Pdgf ΔEx7 (n=5) and Tie2/Pdgf ΔEx7 (n=4) mice, from 8 independent experiments and tamoxifen treated as in (a). The Cre drivers used are indicated on the x-axis. Values are group averages; error bars show standard errors. Student’s t-test P-values relative to the control group are shown. For source data see Supplementary Table 5.
(c) Representative flow cytometric analysis of c-Kit+ DN thymocyte progenitors from the mice in (a). The gates used to identify DN1 (c-Kit+CD25–) and DN2 cells (c-Kit+CD25+) are indicated.
(d) Absolute number of phenotypic Flt3+DN1, Flt3–DN1 and DN2 cells mice from (a). Values are group averages; error bars show standard errors. Student’s t-test P-values relative to the control group are shown. For source data see Supplementary Table 5.
(e) Graph showing the average abundance of Flt3+DN1, Flt3-DN1 and DN2 cells in Tie2ΔEx7, Pdgf ΔEx7 and Tie2/Pdgf ΔEx7 mice relative to Cre- Control mice.
(f) KitL concentration in the serum of the mice in (a). Values are group averages; error bars show standard errors. Student’s t-test P-values relative to the control group are shown. For source data see Supplementary Table 5.

