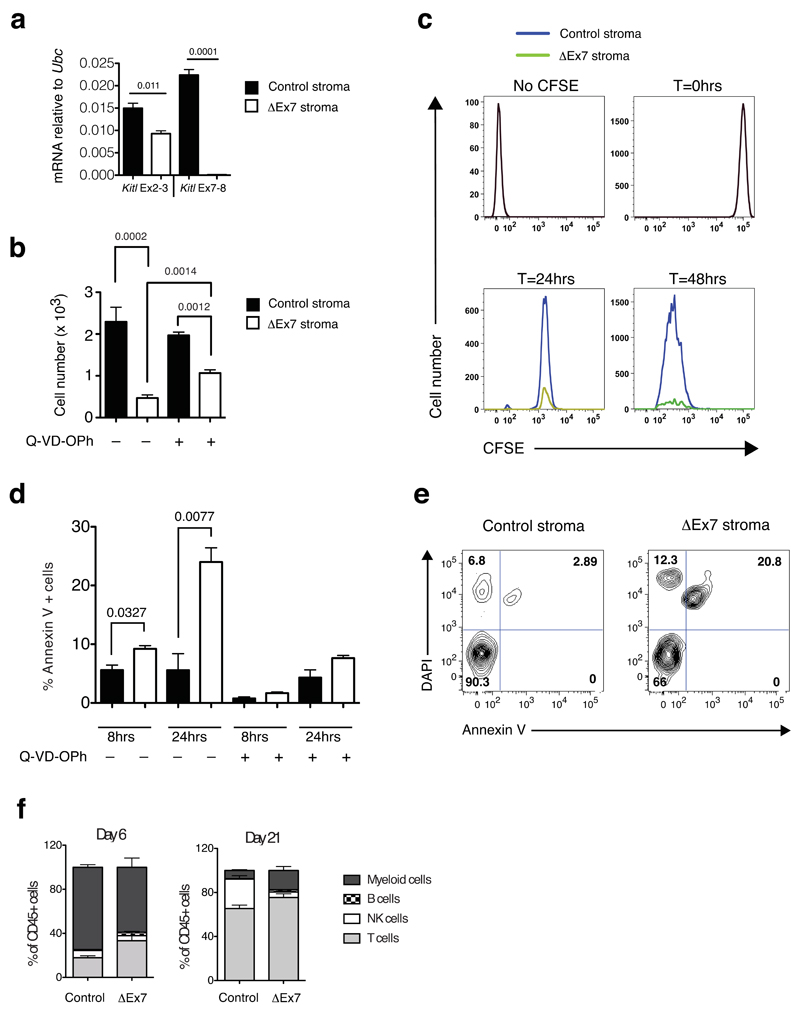
Figure 7. mKitL promotes early thymocyte progenitor survival.
(a) qPCR analysis as in Fig, 5a of cultured thymic stroma from 4-week old KitlLEx7/LEx7;Rosa26-CreERT2 (ΔEx7 stroma) and Kitl+/+;Rosa26-CreERT2 (control (Con) stroma) treated with tamoxifen (4OHT). Each value is the mean, normalized to Ubc mRNA, of 3 biological replicates, each measured in technical triplicate. Error bars show standard errors. Significance of difference in expression level was determined using Student’s t-test; P-values are shown. For source data see Supplementary Table 5.
(b) Total live thymocyte cell number from at 48 after plating DN1 cells on Con and ΔEx7 stroma, in the presence or absence of Q-VD-OPh as indicated (–Q-VD-OPh: N=7; +Q-VD-OPh: n=3 biological replicates pooled over 2 independent experiments). Error bars show standard errors. Significance of difference in expression level was determined using Student’s t-test; P-values are shown.
(c) Representative histogram plots of CFSE labeled DN1 cells 24hrs and 48hrs after plating onto Con or ΔEx7 stroma. Profiles of unstained cells (No CFSE) and CFSE labeled cells prior to plating (T=0hrs) are shown. n at 24 hours=6; n at 48 hours=7. n represents biological replicates pooled over 3 different experiments
(d) Percentage of Annexin V+ cells at 8hrs and 24hrs of culture in control and ΔEx7 cocultures, in the presence or absence of Q-VD-OPh as indicated. n=3 biological replicated for all conditions, pooled over 2 independent experiments. Error bars show standard errors. Significance of difference in expression level was determined using Student’s t-test; P-values are shown. For source data see Supplementary Table 5.
(e) Representative FACS plot at the 24 hour time point of the data shown in (d).
(f) Lineage readout at days 6 and 21 from 3x10³ sorted ETPs plated onto control and ΔEx7 primary thymic stroma. n=3 biological replicates for all conditions, from 2 independent experiments. Error bars show standard errors. For source data see Supplementary Table 5.

