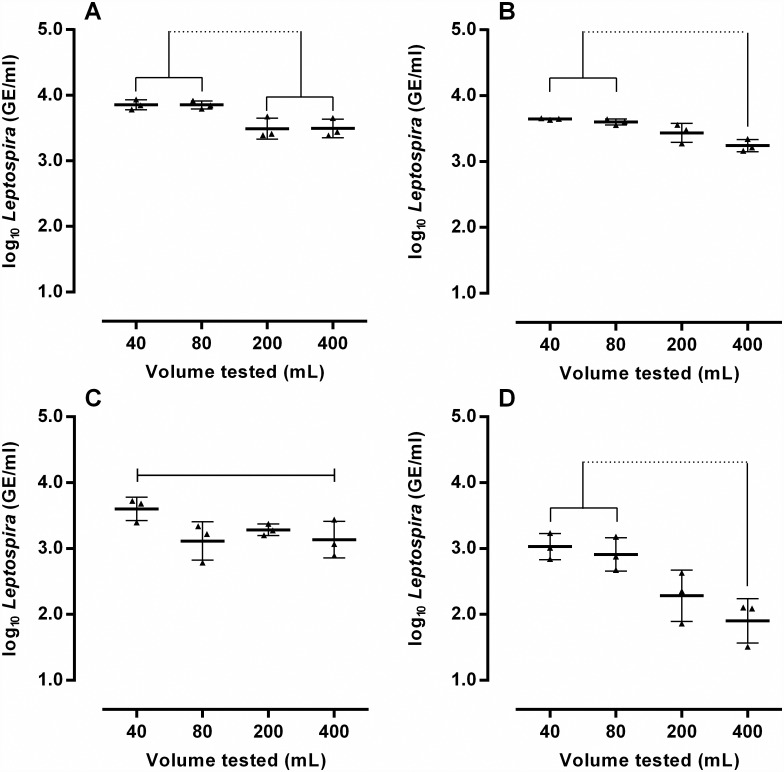
Fig 2. Determination of the optimal volume to be tested by qPCR for different water types: ultrapure water (A), river (B); pond (C) and sewage (D).
Different volumes of each water type were spiked with 1 × 10⁵ leptospires/mL to assess Leptospira recovery. Error bars represent the geometric mean ± SD of the concentrations as determined by qPCR in three independent experiments. Continuous lines connect groups whose average leptospiral DNA concentrations are not statistically significant (p>0.05). Groups whose averages are significantly different (p<0.05) are connected by a dashed line.

