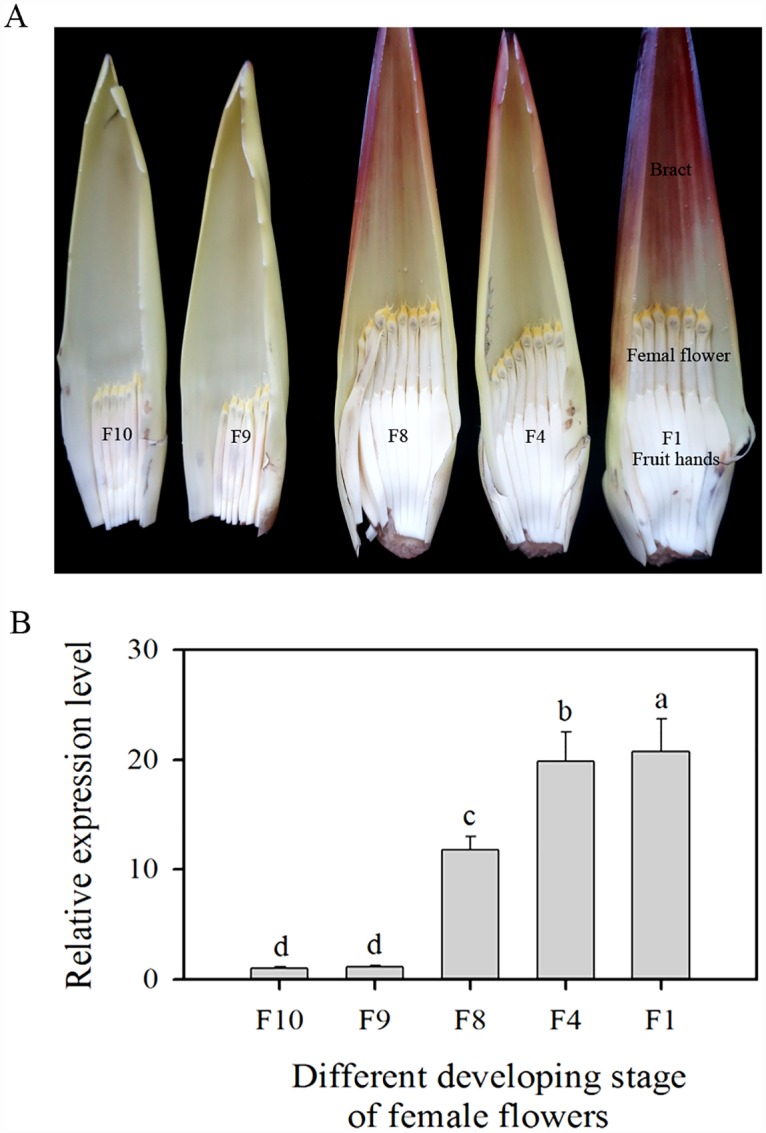
Fig 1. Expression of MaASR gene in banana female flowers from the upper inflorescence.

(A) The female flowers from the tenth (F10), ninth (F9), eighth (F8), fourth (F4), and first (F1) cluster from the upper inflorescence. (B) Relative expression level in banana female flowers. The y-axis represents the relative fold-difference in mRNA level, which was calculated using the 2-ΔΔCT formula with ACTIN and UBQ as internal controls. The vertical bars represent the mean ± SD of three replicates.
