Figure 2.
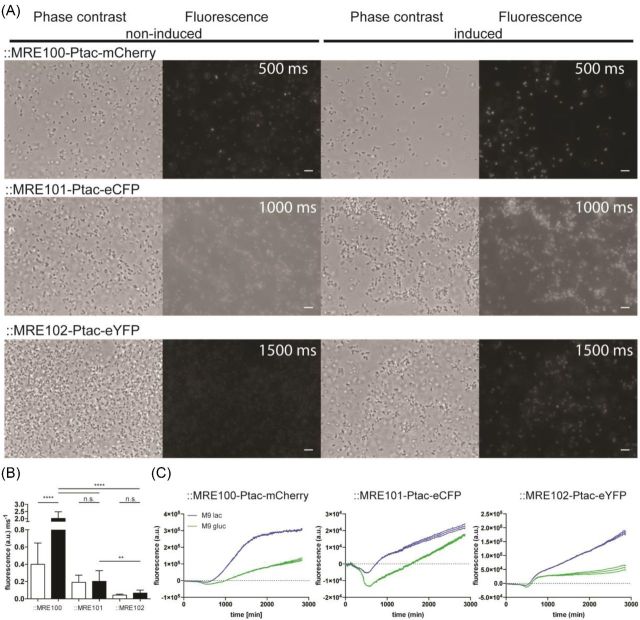
Analysis of chromosomally inserted Ptac fluorescence protein gene labels using microscopy and microtiter plate reader. (A) Phase contrast and fluorescence micrographs of E. coli O157:H7 carrying chromosomally integrated Tn7-transposons containing mCherry, eCFP or eYFP encoding genes under the control of the lactose derepressible tac promoter. The left two columns show phase contrast and fluorescence images of non-induced cells, the right two columns show lactose-induced cells. For fair comparisons of fluorescence intensities and background, a linear contrast was applied to the images. (Exposure times for the respectively measured fluorophores are given in fluorescence micrographs, scale bar = 5 μm.) (B) Average single-cell fluorescence intensity per millisecond exposure after background subtraction. Non-induced cells are represented as white bars, and induced cells as black bars. Statistical differences in fluorescence intensity between treatments were assessed by performing a one-way ANOVA. ** = P < 0.01; **** = P < 0.0001. (C) Background-subtracted fluorescence of E. coli O157:H7 carrying the Tn7 insertions or wild-type cells cultivated under non-induced or induced conditions. Lines reflect floating averages of three replicates; stippled lines reflect the standard deviation of the mean.

