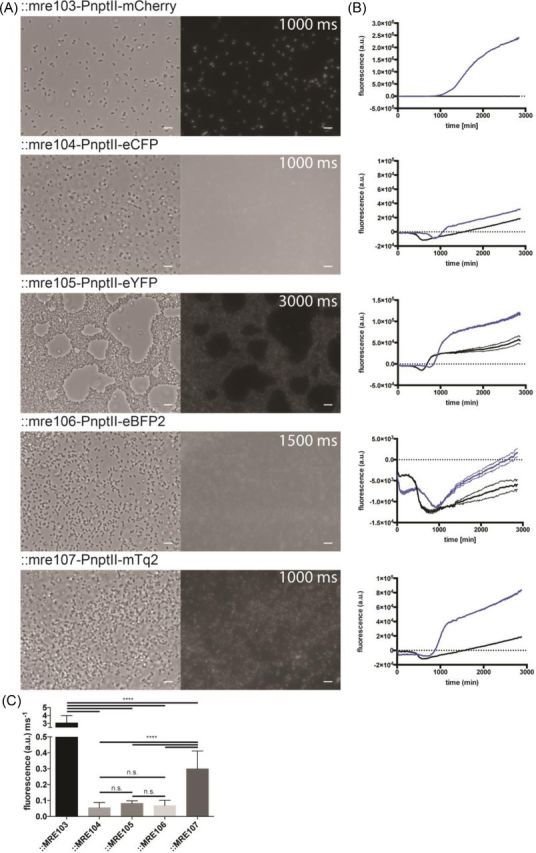
Figure 3.

(A) Phase contrast and fluorescence micrographs of E. coli O157:H7 carrying chromosomally integrated Tn7 transposons containing mCherry, eCFP, eYFP, eBFP2 or mTurquoise2 encoding genes under the control of the constitutive nptII promoter. The first column shows phase contrast images, the second corresponding fluorescence images (exposure times are given in the fluorescent images, scale bars = 5 μm). For fair comparisons of fluorescence intensities and background, a linear contrast was applied to the images. (B) Fluorescence intensity of E. coli O157:H7 carrying the Tn7 insertions or wild-type cells. Lines reflect the mean of three replicates; stippled lines reflect the standard deviation of the mean. (C) Average single-cell fluorescence intensity per millisecond exposure after background subtraction. Statistical differences in fluorescence intensity between treatments were assessed by performing a one-way ANOVA, and significant differences are indicated in the graph. **** = P < 0.0001.
