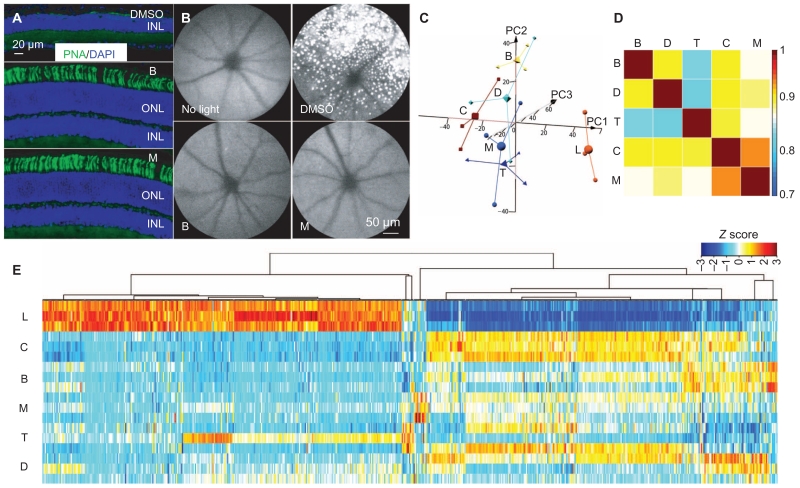
Fig. 3. Retina protection conferred by monotherapy.
(A) Retinal expression of PNA (green) along with DAPI counterstaining (blue) was examined in cryosections collected from light-exposed Abca4−/−Rdh8−/− mice pre-treated with DMSO, BRM, or MTP. (B) Autofluorescent spots in the retinas of Abca4−/−Rdh8−/− mice imaged after exposure to bright light. Abca4−/−Rdh8−/− mice were pretreated as indicated and exposed to bright light, and then SLO was performed to visualize autofluorescence in retinas of Abca4−/−Rdh8−/− mice. (C to E) Total RNA from the indicated experimental groups (n = 3 per group) was isolated from Abca4−/−Rdh8−/− mice 1 day after light exposure, along with mice unexposed to bright light. Total RNA was then subjected to RNA-seq analysis. (C) Three-dimensional (3D) PCAs of all expressed transcripts are shown for the control mice unexposed to bright light (C), light-exposed, DMSO-pretreated mice (L), and mice pre-treated with either BRM (B), MTP (M), DOX (D), or TAM (T). Small shapes represent individual samples, and large shapes are the centroid representations for each group. (D) Pearson’s correlation plots of differentially expressed transcripts from retinas of mice unexposed to bright light and the indicated pretreatment groups. Scale bar indicates correlation co-efficient with identity orange (correlation coefficient, 1). (E) Gene expression clustering of the differentially expressed transcripts is shown for mice with the indicated pretreatments along with clustering from mice unexposed to light and DMSO-pretreated mice exposed to light. Data are shown for the three independent samples in each treatment. Scale bar represents the Z score indicating up-regulation (orange) and down-regulation (blue).

