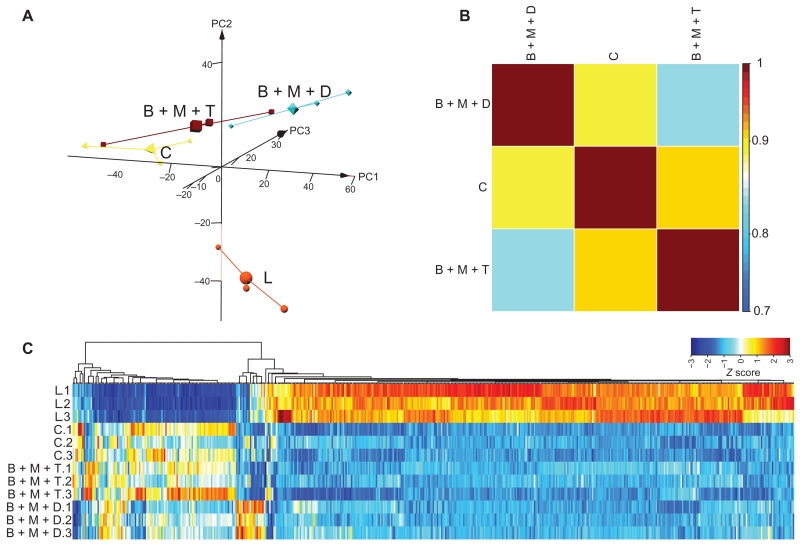
Fig. 7. RNA-seq analysis of retinal gene expression in Abca4−/−Rdh8−/− mice pretreated with drug combinations.
Total RNA from the indicated experimental groups (n = 3 per group) was isolated from Abca4−/−Rdh8−/− mice 1 day after light exposure, along with mice unexposed to bright light. Total RNA was then subjected to RNA-seq analysis. (A) 3D PCAs of all expressed transcripts are shown for the control mice unexposed to bright light (C), light-exposed, DMSO-pretreated mice (L), and mice pretreated with combinations of either BRM, MTP, and TAM (B + M + T) or BRM, MTP, and DOX (B + M + D). (B) Pearson’s correlation plots of the differentially expressed transcripts from retinas of mice unexposed to bright light or subjected to combination therapy before light exposure. Scale bar represents correlation coefficient. (C) Gene expression clustering of differentially expressed transcripts is shown for mice with the indicated combined pre-treatments along with clustering from mice unexposed to light and DMSO-pretreated mice exposed to light. Scale bar represents the Z score indicating up-regulation (orange) and down-regulation (blue).

