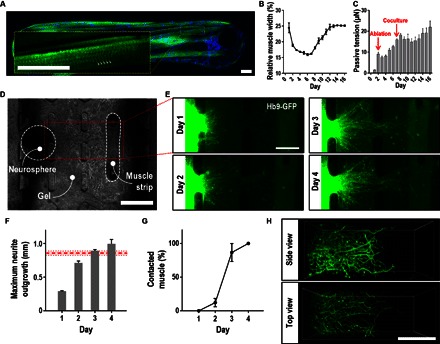
Fig. 5. Muscle differentiation and neuromuscular tissue formation.

(A) Immunostaining of the myogenic marker α-actinin (green) and DAPI (blue), demonstrating proper muscle differentiation and formation of sarcomeric striations (examples of striations are indicated by arrowheads in the inset). Scale bars, 50 μm. (B) Muscle bundle width relative to the width at day 0. (C) Passive force generation over the course of 16 days. (D) Representative image of a neuron-muscle coculture in the microfluidic device on day 1 of coculture. Scale bar, 500 μm. (E) Neurite extension over 4 days of coculture. Scale bar, 250 μm. (F) Absolute maximum neurite outgrowth in millimeters over the first 4 days of culture. For comparison, the red dashed line represents the average initial distance between neurospheres and muscle bundles (the shaded area in between the dotted line indicates the SEM). (G) Percentage of muscle bundles contacted by at least one neurite over the course of 4 days. (H) Confocal 3D reconstruction of neurites in the bridge gel region after 1 day of coculture. Scale bar, 200 μm. All error bars, SEM.
